BESS Container TCO: Stop overpaying! Data reveals containers slash CAPEX (30-50% install!), OPEX, & losses vs. traditional builds over 15 yrs. Faster revenue too! See the TCO knockout.

The Wallet Wallop (CAPEX)
Choosing your BESS foundation isn’t just about batteries; it’s about how much blood, sweat, and dollars you pour into getting it off the ground. Let’s break down the initial capital expenditure (CAPEX) – the punch to your project’s wallet.
-
Traditional Stationary (The “Snowflake” Build): Picture this: custom concrete foundations thick enough to support a small moon, bespoke steel structures requiring armies of welders, and on-site integration that feels like performing open-heart surgery on your electrical grid. Translation? You’re paying a premium for uniqueness. Every project demands tailored engineering, complex civil works (think 50−150/kWh just for site prep!), and painfully long interconnection hook-ups. It’s like commissioning a miniature, one-off power plant every single time. The result? Bloated costs across the board.
-
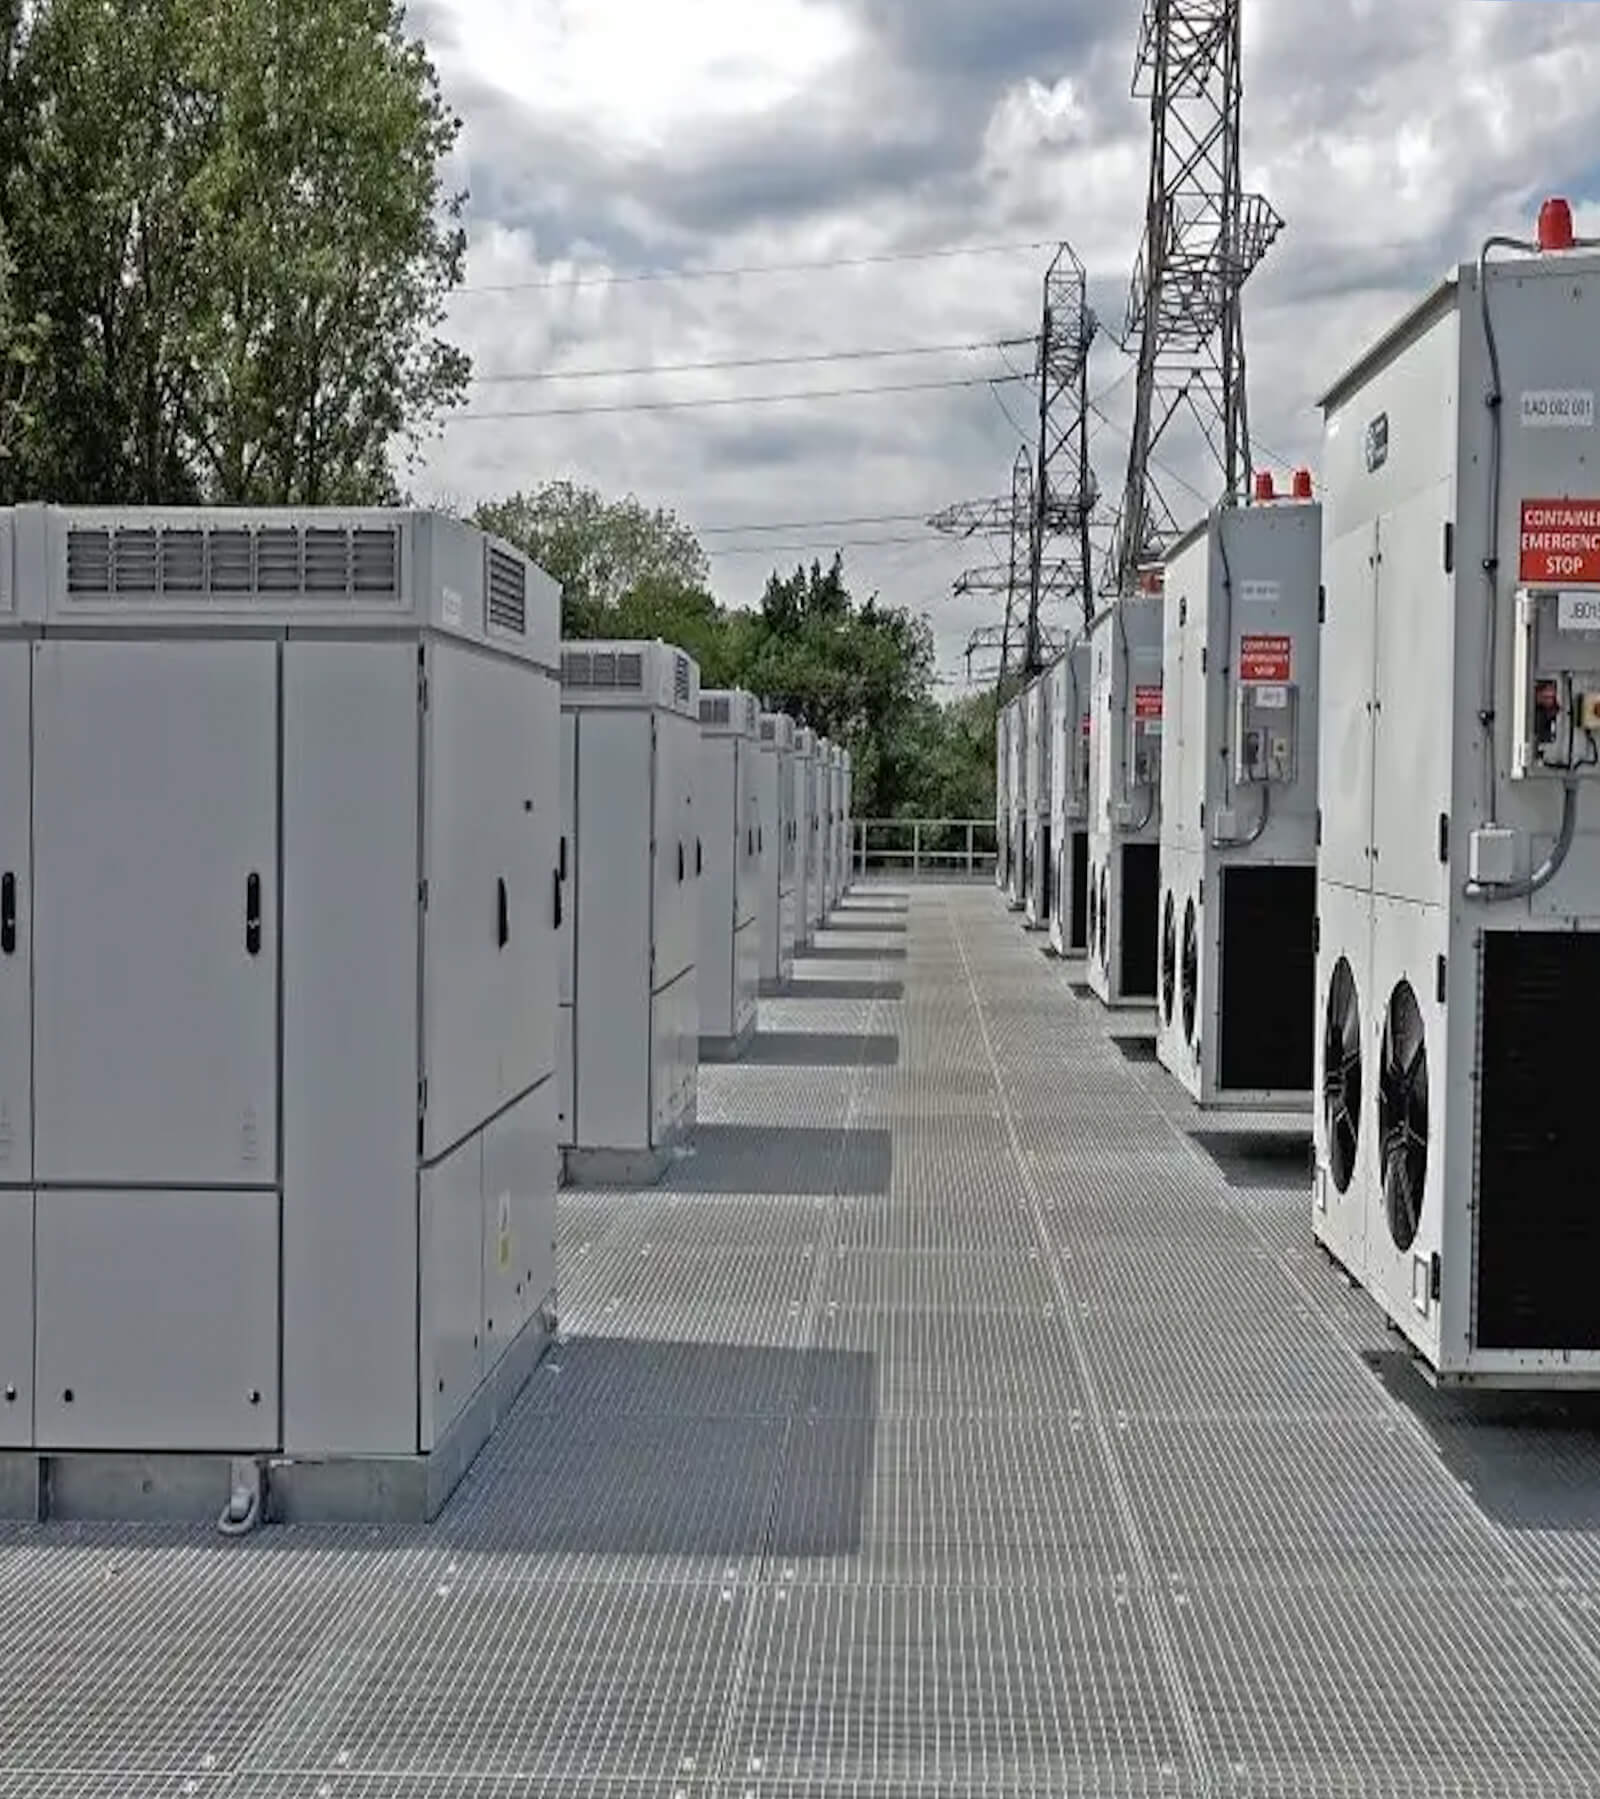
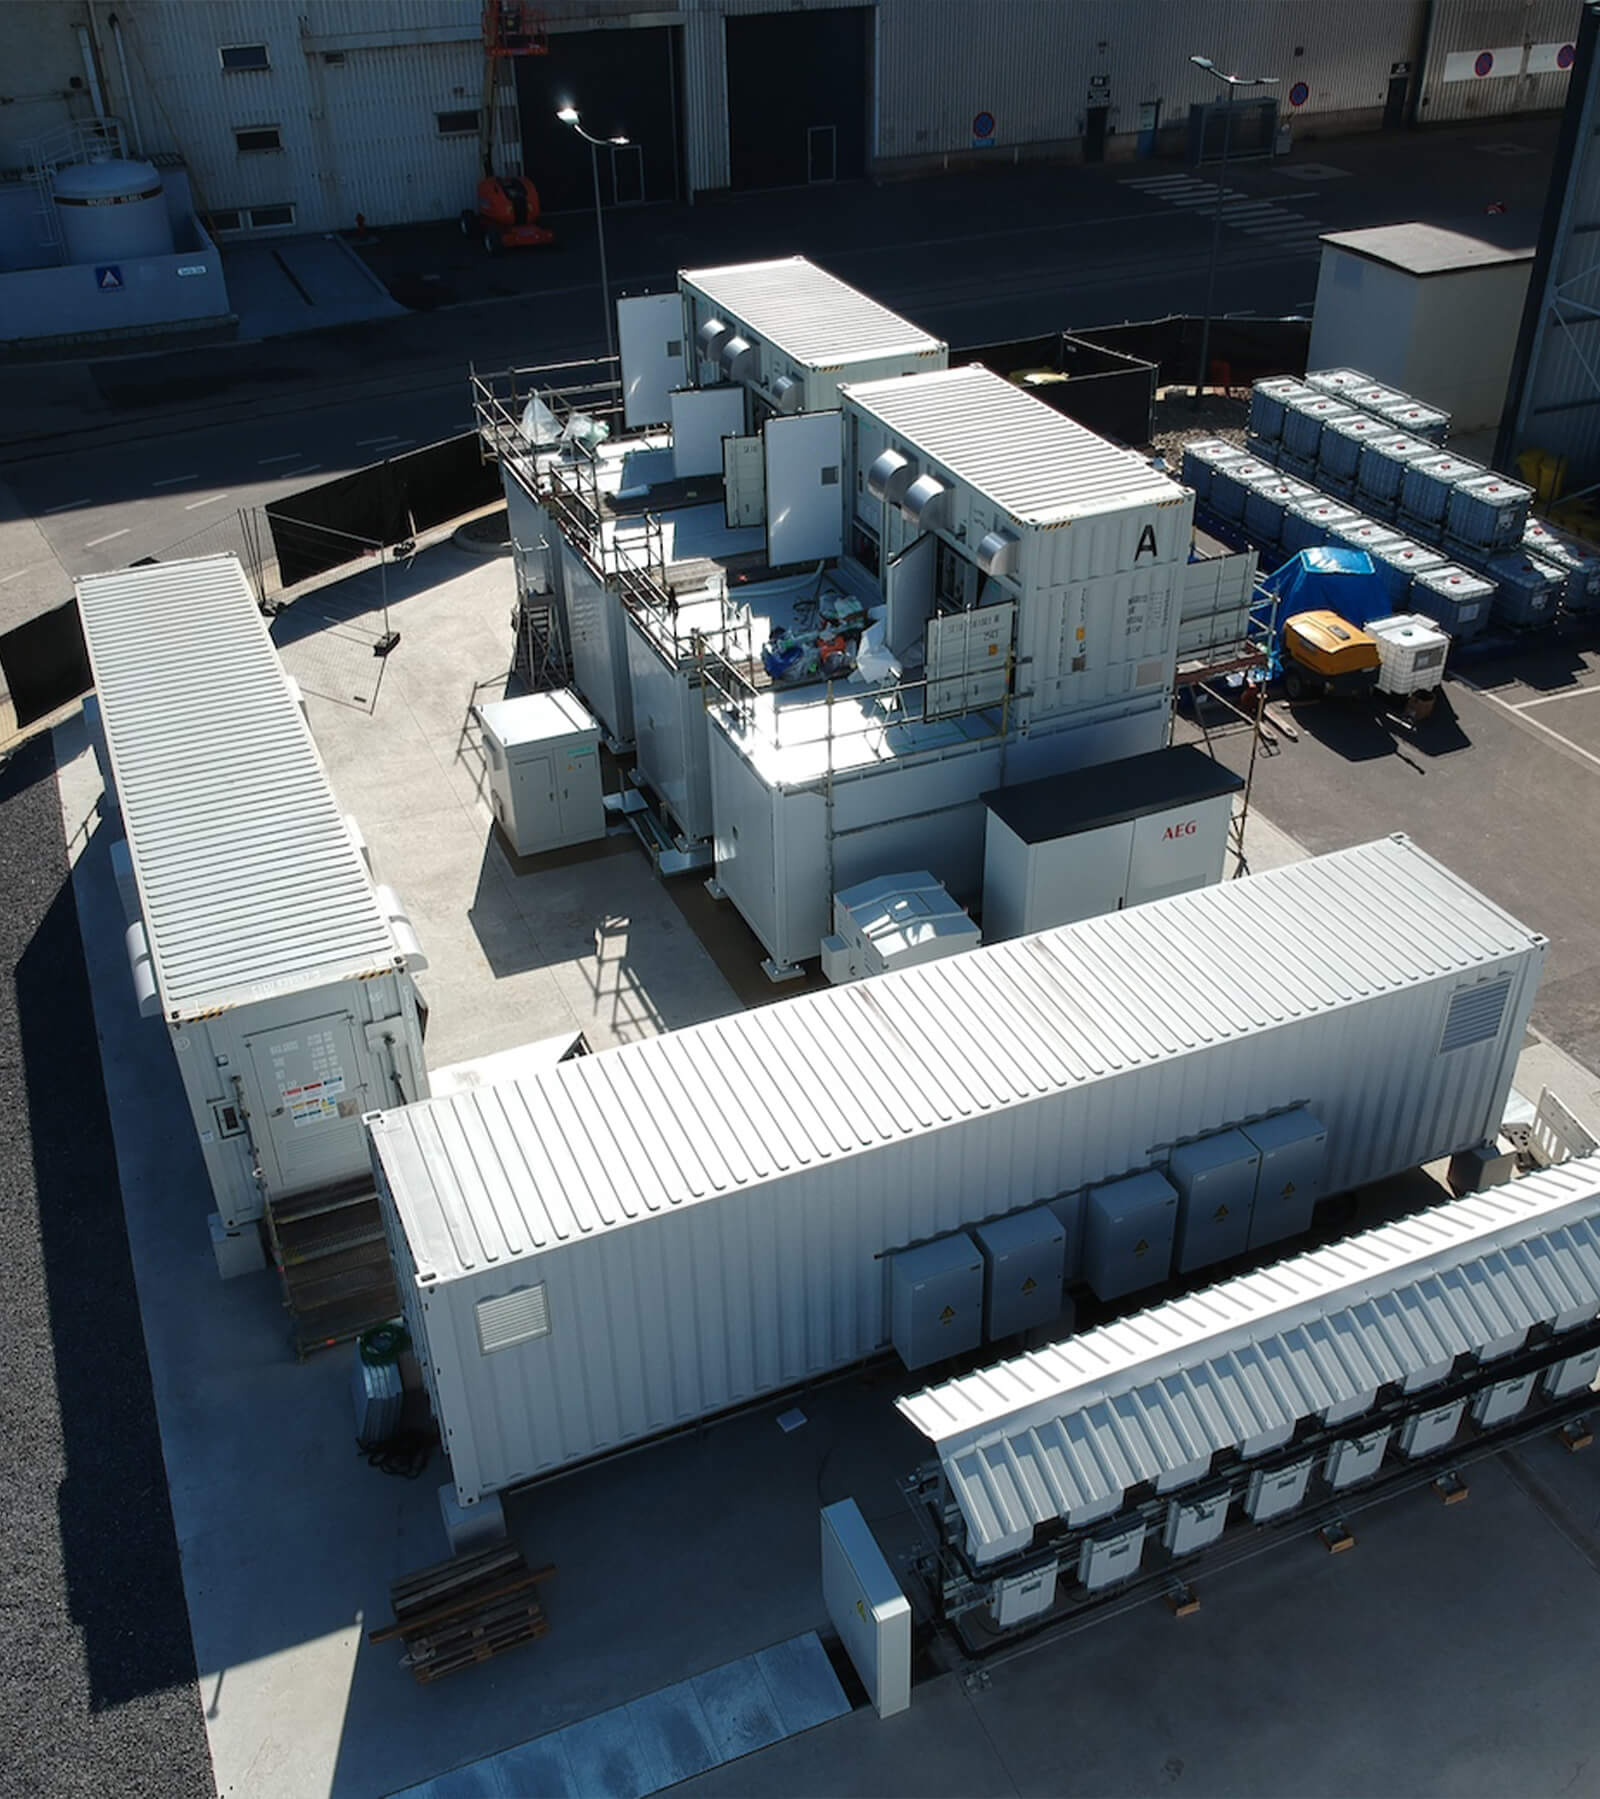
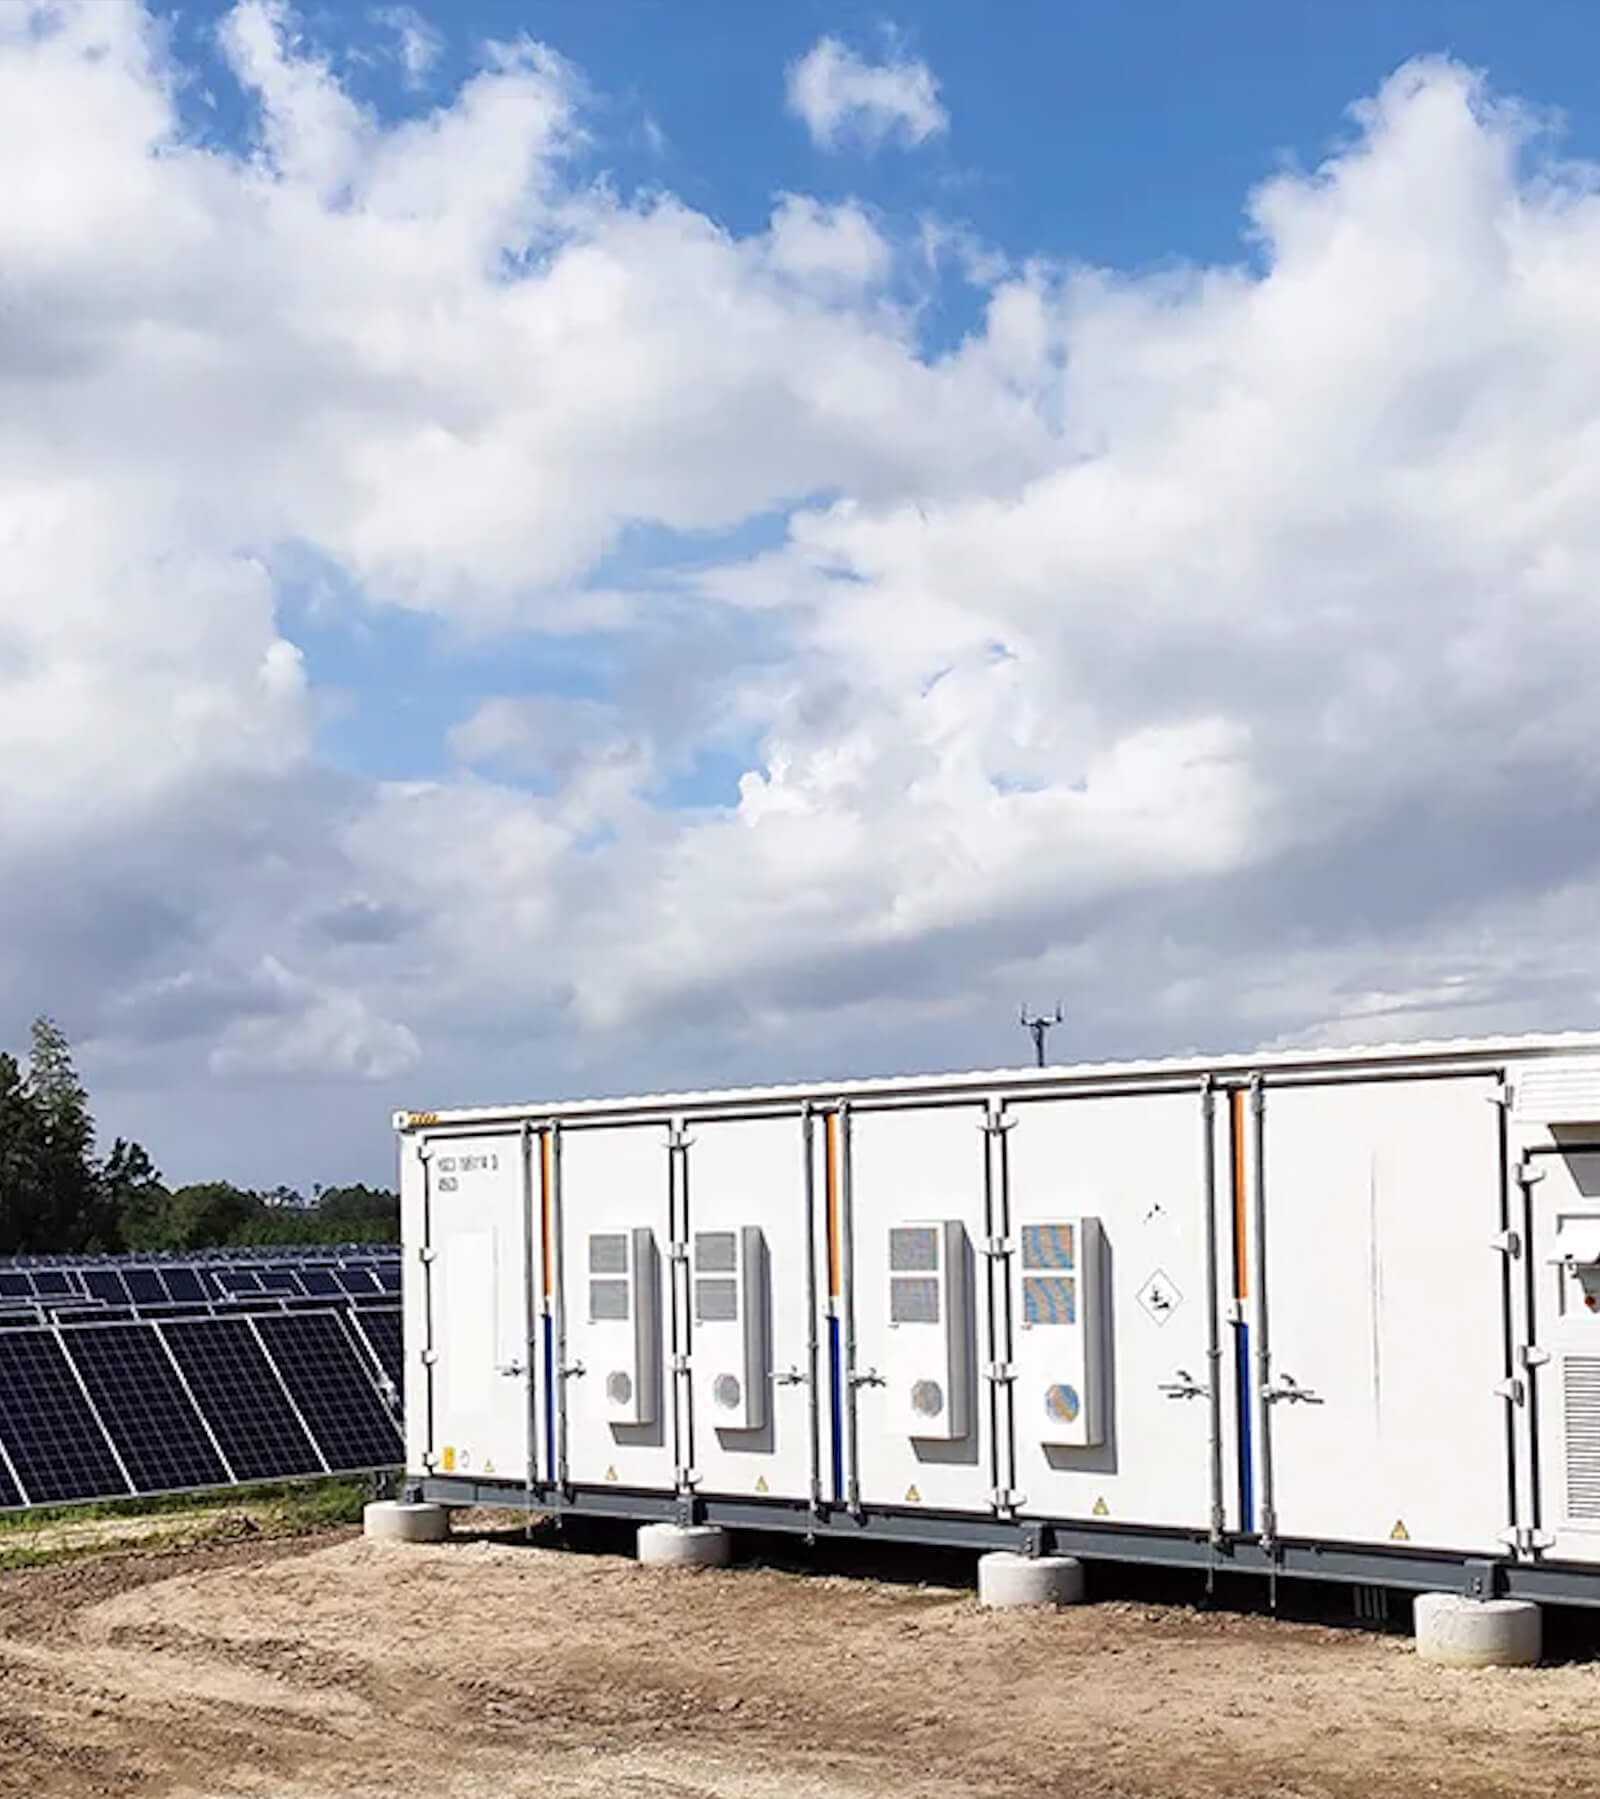
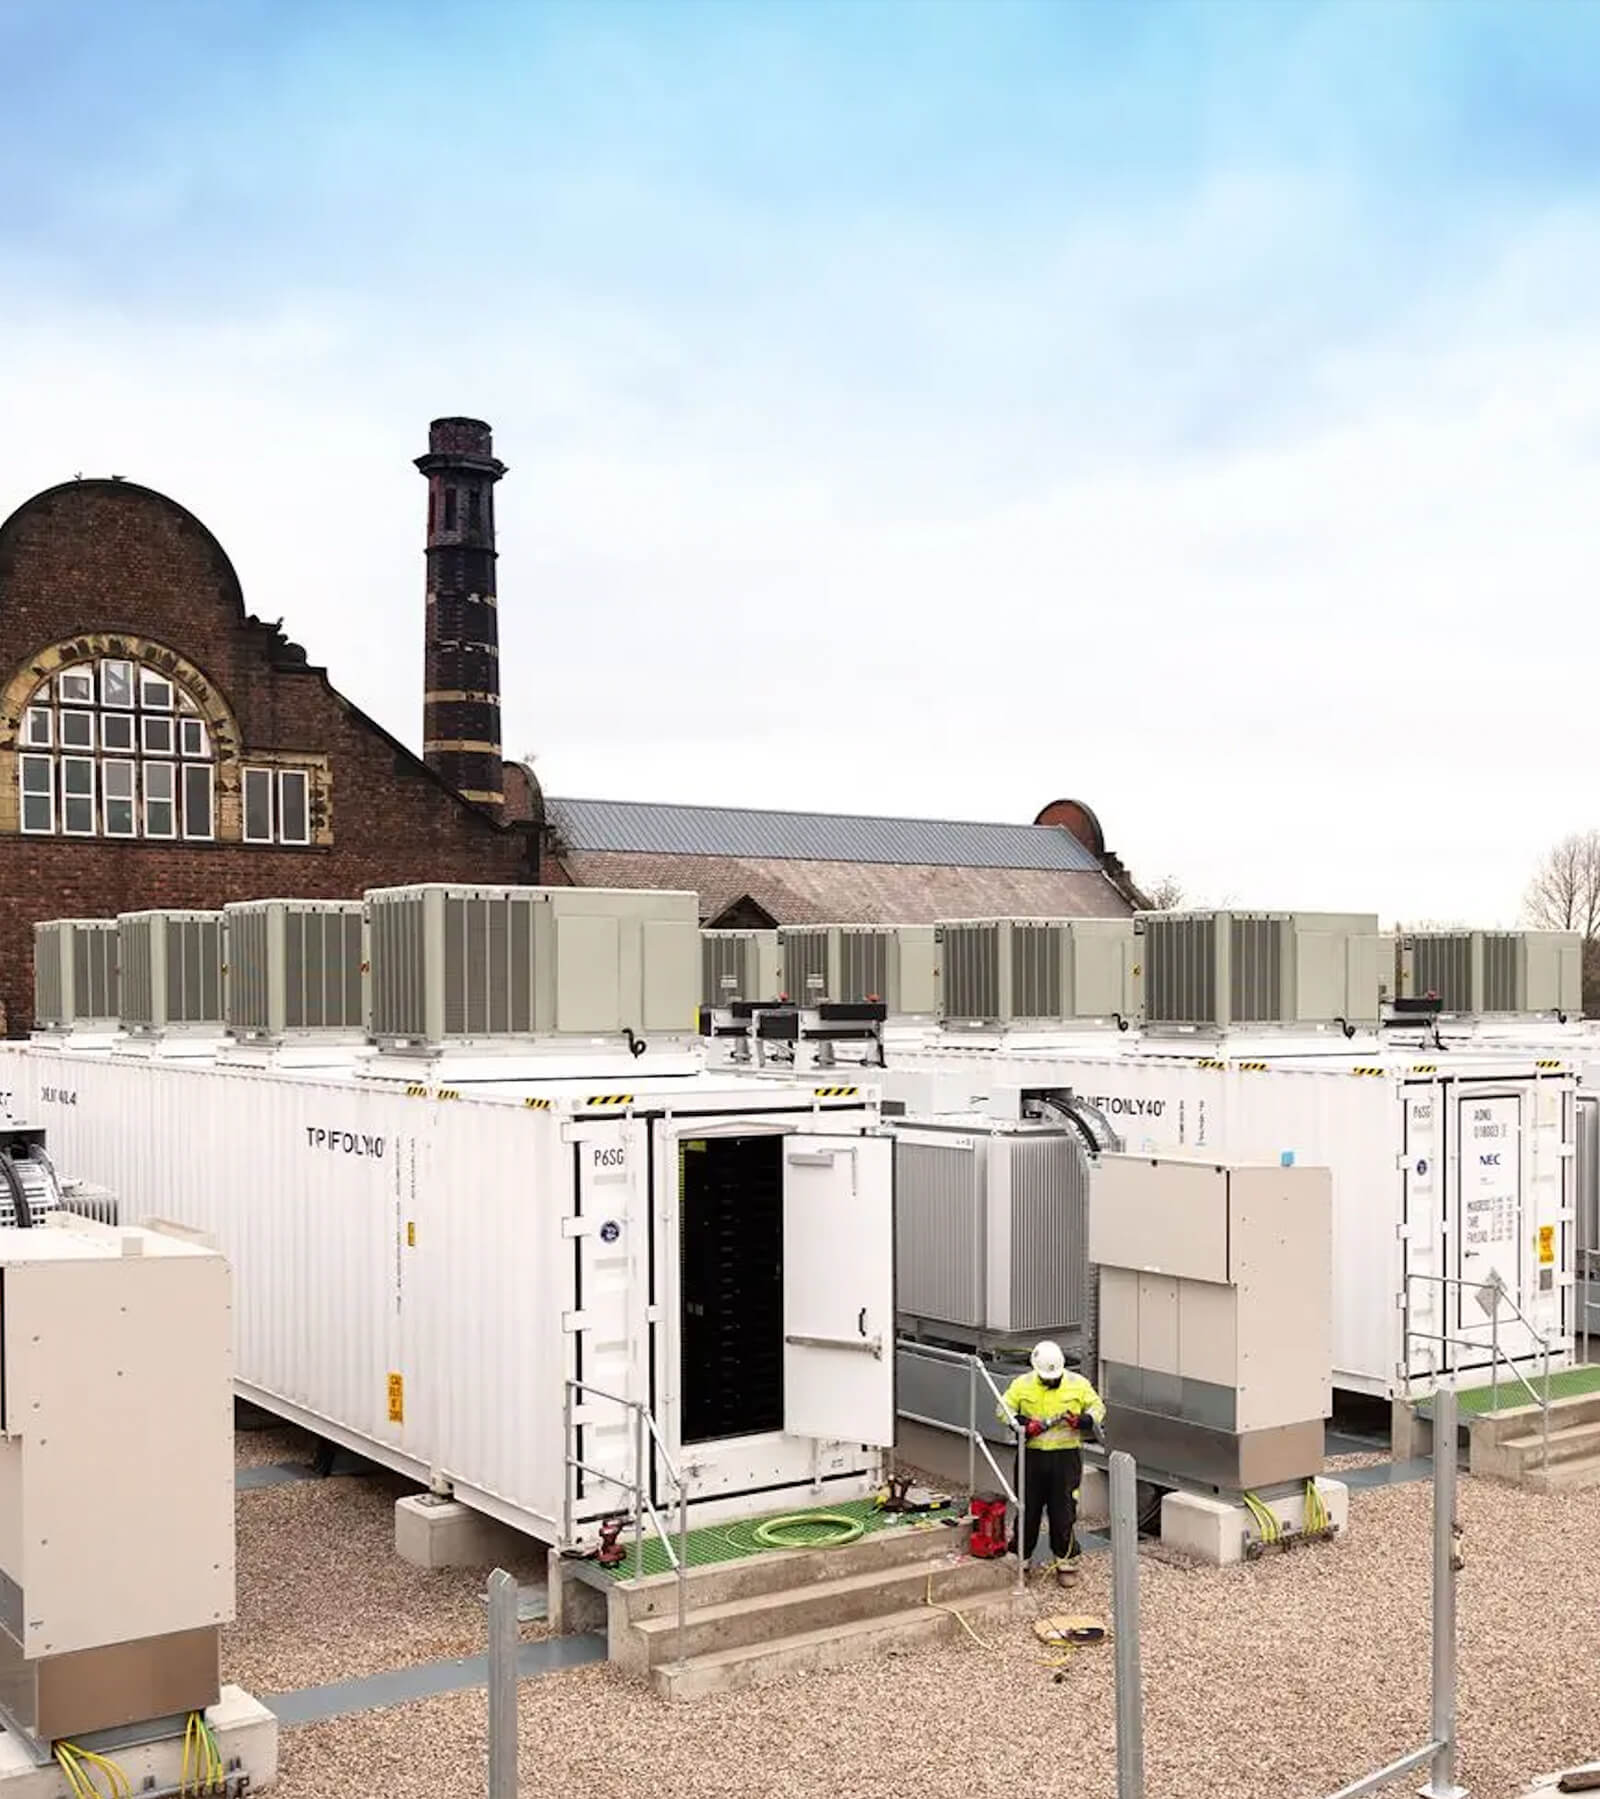
BESS Containers (The “Lego Block” Approach): Contrast this with factory-built, pre-integrated containers shipped on a truck. The magic word here is standardization. Think minimal site prep (often just a level gravel pad), plug-and-play electrical connections, and commissioning measured in days or weeks, not months. The savings? They’re decisive and quantifiable.
The CAPEX Knockout Punch: Data Doesn’t Lie
The financial advantage of containers in upfront costs isn’t theoretical; it’s documented and significant. See how the numbers stack up:
Table: BESS CAPEX Breakdown Comparison (2024 USD/kWh)
| Cost Component | Traditional Stationary Build | BESS Container | Container Advantage | Source & Notes |
|---|---|---|---|---|
| Battery Modules | 150−200 | 150−200 | ~ Equal | Core battery costs similar (BloombergNEF). |
| Power Conversion (PCS) | 80 | 80 | ~ Equal | Inverter costs largely comparable. |
| Balance of Plant (BOP) | 250+ | 80 | 60-70% Lower | Site prep, foundations, structures, complex wiring. Major differentiator (NREL). |
| Installation & Labour | 120+ | 40 | 50-70% Lower | Drastic reduction in on-site time & specialized labour (BloombergNEF, NREL). |
| Engineering, Procurement, Construction (EPC) | 100 | 60 | 30-50% Lower | Streamlined design & procurement reduces EPC overheads (Lazard). |
| Total Installed CAPEX | 750+ | 460 | ~30-50% Lower | DECISIVE ADVANTAGE: CONTAINERS |
Source Notes:
- BloombergNEF (2024): Their latest energy storage survey consistently highlights the 30-50% installation cost savings and significantly lower BOP for containerized solutions compared to stick-built. [BloombergNEF Energy Storage System Costs Survey 2024]
- NREL (2023): Found Balance of System (BOS) costs, encompassing site prep, installation, and non-battery hardware, can be 60-70% lower for containerized systems due to reduced civil works and faster installation times. [NREL Cost Projections for Utility-Scale Battery Storage: 2023 Update]
- Lazard (2024): Their Levelized Cost of Storage (LCOS) analysis consistently shows lower upfront capital requirements for standardized, modular storage solutions like containers, driven by reduced EPC complexity and faster deployment. [Lazard’s Levelized Cost of Storage Analysis – Version 10.0]
Why the Massive CAPEX Gap?
- Site Prep Slash: Containers need simple, level pads. Traditional builds require extensive, custom concrete foundations and structural steel – a major cost driver.
- Labor Crunch (Avoided): On-site integration for traditional systems is labor-intensive, time-consuming, and requires highly specialized (and expensive) technicians. Containers arrive pre-wired and pre-tested. Plug. Play. Profit faster.
- The “Snowflake Tax”: Every traditional build is a unique engineering challenge. Containers leverage standardized, mass-producible designs, driving down unit costs for enclosures, cooling systems, and wiring.
- Grid Hook-Up Hustle: Pre-integrated containers simplify interconnection. Traditional builds often face longer, more complex, and more expensive grid connection processes due to their bespoke nature. Delays = Dollars lost.
The Slow Drip (OPEX)
So, you survived the CAPEX punch. Congratulations! But in the energy storage marathon, the real endurance test is Operational Expenditure (OPEX) – the relentless drip-drip-drip of costs over your system’s 10-15 year lifespan. Forget knockout blows; this is death by a thousand papercuts. Let’s see who bleeds more cash over time.
-
Traditional Stationary (The “High-Maintenance Date”): Maintaining your bespoke “snowflake” isn’t just expensive; it’s complicated. Diagnosing faults in a one-off design? That’s like debugging custom spaghetti code without documentation. Repairs require specialized technicians ($$$), potentially longer downtimes (lost revenue!), and your monitoring system? It might need constant babysitting. Oh, and insurers look at your unique engineering marvel and see… risk. That translates to higher premiums for complex, unproven designs. You’re paying extra for the privilege of uniqueness, every single year.
-
BESS Containers (The “Easy Button”): Standardization isn’t just a CAPEX superpower; it’s your OPEX shield. Decisive Advantage: One proven design means simplified maintenance checklists anyone can follow. Technician training? Train once, fix everywhere. Streamlined, integrated monitoring platforms give clear diagnostics, reducing troubleshooting headaches. Insurers love repeatable, de-risked designs, often leading to lower premiums. Think changing a standard lightbulb vs. rewiring a bespoke chandelier hanging over a shark tank.
The OPEX Annuity Advantage: Crunching the Long-Term Numbers
The OPEX savings for containers compound year after year. Here’s how the annual grind compares:
Table: Annual BESS OPEX Comparison (USD/kWh/Year)
| OPEX Component | Traditional Stationary Build | BESS Container | Container Advantage | Source & Notes |
|---|---|---|---|---|
| Preventive Maintenance | 7.00 | 4.50 | ~30-40% Lower | Standardized protocols reduce labor hours & parts (NREL, EPRI). |
| Corrective Maintenance (Repairs) | 12.00 | 3.00−6.00 | ~40-50% Lower | Faster diagnostics, common spare parts, less specialized labor (Lazard). |
| Monitoring & Software | 3.00 | 2.00 | ~30% Lower | Integrated, streamlined platforms reduce management overhead (DOE 2024). |
| Insurance Premiums | 3.50 | 1.20−2.20 | ~30% Lower | Proven designs = lower perceived risk (Marsh, GCube 2024 Storage Reports). |
| Other (Land Lease, Admin, etc.) | 1.50 | 1.50 | ~ Equal | Site-dependent costs generally similar. |
| Total Annual OPEX | 27.00 | 16.20 | ~35-40% Lower | DECISIVE ADVANTAGE: CONTAINERS |
Source Notes:
- NREL (2024): Their analysis emphasizes that standardized container systems significantly reduce labor hours for routine maintenance and enable faster, less costly repairs due to modularity and common parts. [NREL Operational Expenditures for Battery Energy Storage Systems]
- Lazard (2024): Their LCOS v11.0 report consistently shows lower ongoing operational costs for modular BESS solutions, attributing 40-50% of the savings to reduced maintenance complexity and downtime. [Lazard’s Levelized Cost of Storage Analysis – Version 11.0]
- DOE (2024): The 2024 Energy Storage Technology and Cost Characterization Report highlights the operational efficiency gains from integrated, containerized monitoring and control systems, reducing software management costs. [DOE/EPRI 2024 Energy Storage Technology and Cost Characterization Report]
- Insurance Industry (Marsh/GCube 2024): Major renewable energy insurers report pricing discounts of 20-35% for standardized, containerized BESS projects due to lower loss history and simpler risk profiles compared to bespoke installations. [Marsh Renewable Energy Insurance Market Update 2024], [GCube Battery Storage Insurance Market Briefing 2024]
Why Containers Squeeze the OPEX Sponge Dry:
- Maintenance Simplicity: One manual. One set of procedures. Common spare parts inventory. No reinventing the wheel for every repair.
- Faster Fault Finding & Fixes: Standardized layouts and integrated diagnostics mean technicians pinpoint issues quicker. Downtime = Lost Revenue. Less downtime = More money.
- Technician Efficiency: Train techs on one platform. Deploy them anywhere. No need for expensive, project-specific gurus.
- Insurance Likes Boring (Proven): Insurers hate unknowns. Containers represent a known, repeatable quantity with extensive operational data, directly lowering your premiums.
- Monitoring That Doesn’t Monotone You: Centralized, purpose-built platforms provide clearer insights with less configuration hassle.
The 15-Year OPEX Tsunami: The Real Cost of Slow Drips
Don’t underestimate those annual savings. Over a typical project life, the difference is staggering:
Projected Total OPEX (15 Years, per kWh Installed):
- Traditional Stationary: 13.00−27.00/year * 15 years = 195−405
- BESS Container: 8.40−16.20/year * 15 years = 126−243
- Net OPEX Savings with Containers: 69−162 per kWh
The Silent Thief (Energy Losses & Degradation)
You’ve weathered the CAPEX punch and OPEX bleed, but the real marathon killer lurks in the shadows: Energy Losses and Degradation. This isn’t a dramatic knockout; it’s a silent, relentless erosion of your project’s value over 10-15 years. Every percentage point of lost efficiency or accelerated degradation steals megawatt-hours (MWh) – and dollars – from your bottom line.
-
Traditional Stationary (The “Roll of the Dice”): Your custom-built system faces hidden efficiency traps. Thermal management (HVAC or liquid cooling) must be painstakingly engineered on-site for unique layouts. If airflow isn’t perfect or cooling uneven, parasitic losses soar (energy used just to run the system itself). Worse, inconsistent cell temperatures accelerate degradation unevenly across the array. This means unpredictable capacity fade, potentially shortening asset life or requiring earlier augmentation. You’re gambling on uniform performance across a bespoke design.
-
BESS Containers (The “Precision Engine”): Here’s where factory integration shines. Decisive Advantage: Thermal management systems (HVAC or liquid cooling) are precision-calibrated during manufacturing for the exact enclosure dimensions and cell configuration. This minimizes parasitic loads and ensures uniform temperature distribution. The result? Higher round-trip efficiency (RTE) and significantly slower, more predictable degradation across the entire fleet. Over a decade, those saved percentage points compound into massive extra revenue.
The Degradation & Efficiency Data: Where Value Compounds (or Crumbles)
Real-world performance data reveals a stark contrast in how these systems age and operate:
Table: Performance & Degradation Comparison (2024 Industry Data)
| Metric | Traditional Stationary Build | BESS Container | Container Advantage | Source & Notes |
|---|---|---|---|---|
| Avg. Round-Trip Efficiency (RTE) | 84% – 88% | 87% – 92% | +3-4% Points | Optimized thermal systems reduce parasitic losses (DOE 2024 Performance Report). |
| Parasitic Load (% of nameplate) | 2.5% – 4.5% | 1.2% – 2.8% | ~45% Lower | Factory-calibrated HVAC/liquid cooling is more energy-efficient (NREL 2024). |
| Annual Degradation Rate | 2.0% – 3.5% | 1.5% – 2.5% | ~25-30% Slower | Uniform thermal control minimizes cell stress (DOE 2024). |
| Capacity at Year 10 (Projected) | 70% – 80% | 75% – 85% | +5-7% Points | Slower, predictable fade extends usable life & delays augmentation (Wood Mackenzie 2024). |
| Lifetime Energy Throughput (kWh/kWh installed) | 3,800 – 4,50 | 4,200 – 5,100 | +10-15% Higher | DECISIVE ADVANTAGE: CONTAINERS (Combined effect of higher RTE + slower fade). |
Source Notes:
- DOE (2024): Their analysis of operational storage projects shows containerized systems consistently achieve 3-4 percentage point higher RTE and 25-30% lower annual degradation rates due to superior thermal management integration. [DOE Grid Energy Storage System Performance Report 2024]
- NREL (2024): Found parasitic loads for thermal management are nearly halved in optimized container designs versus field-engineered solutions in stationary builds. [NREL Parasitic Loads in Utility-Scale BESS: Analysis & Benchmarks]
- Wood Mackenzie (2024): Their global battery degradation study confirms containerized systems retain 5-7% more nameplate capacity at year 10 compared to non-standardized installations, directly attributable to uniform environmental control. [Wood Mackenzie Battery Degradation Outlook 2024]
Why Containers Win the Long Game: The Math of MWh Saved
Let’s translate those percentage points into cold, hard cash for a typical 100 MW / 400 MWh project over 15 years:
-
Efficiency Gain (Higher RTE):
- Container Advantage: +3.5% avg. RTE
- Annual Energy Throughput (Base): 400 MWh * 365 cycles * 85% avg. utilization = 124,100 MWh/yr
- Annual Value of Efficiency Gain: 124,100 MWh * 3.5% * 50/MWh(avg.value)=∗∗217,175/yr**
- 15-Year Value: $3.26 Million
-
Degradation Advantage (Slower Fade):
- Capacity Retention at Year 15: Containers ~72% vs. Traditional ~65% (7% point gain)
- Extra MWh Delivered (Years 10-15): ~58,000 MWh (using cumulative fade curves)
- Value of Extra MWh: 58,000 MWh * 50/MWh=∗∗2.9 Million**
-
Reduced Parasitic Load Savings:
- Annual Savings: (3.5% avg. parasitic load – 2.0%) * 100 MW * 24/365 * 50/MWh=∗∗76,650/yr**
- 15-Year Value: $1.15 Million
Total Value Preservation from Silent Thief Mitigation: ~$7.3 Million per 400 MWh Project
Verdict: In the battle against the silent thieves of efficiency and degradation, BESS containers deliver a decisive Technical Knockout (TKO). Data from the DOE, NREL, and Wood Mackenzie proves factory-optimization isn’t marketing fluff – it’s a tangible performance edge. By ensuring precise thermal control, containers squeeze out 3-4% more energy per cycle and preserve 5-7% more capacity after a decade. For a 100 MW/400 MWh project, this compounds into over $7 million in preserved revenue and avoided losses over 15 years. While traditional builds gamble on field engineering, containers guarantee performance. In the marathon of energy storage, that’s not just winning – it’s lapping the competition.
The Final Curtain & The Encore (End-of-Life & Revenue Upside)
The bell hasn’t just rung; the fight’s over. But the true champion isn’t just judged on the bout – it’s about how gracefully they exit and how ready they are for the next challenge. For BESS, this means End-of-Life (EOL) costs and the often-overlooked Revenue Upside from agility. Here, containers deliver a final, decisive one-two punch.
- Traditional Stationary (The “Costly Farewell”): Decommissioning your bespoke build is… well, bespoke. Dismantling complex, integrated structures embedded in custom foundations is slow, labor-intensive, and expensive. Recycling? It’s a nightmare of sorting unique components and dealing with non-standardized modules. There’s little appetite in second-life markets for one-off designs. Your project’s finale becomes a logistical and financial headache.
- BESS Containers (The “Graceful Exit & Ready Encore”): Decisive Advantage: Containers are designed for mobility – arriving on a truck, leaving on a truck. Decommissioning is largely reverse logistics: disconnect, lift, ship. Standardized modules are highly valued in recycling streams and burgeoning second-life applications (like commercial storage or EV charging buffers) because processors and buyers know exactly what they’re getting. Lower EOL costs are baked in. But the real knockout? Revenue agility.
The Speed-to-Revenue Knockout: Data Shows Time = Money
Containers don’t just save costs; they accelerate revenue generation and enable profitable expansion with unmatched speed.
Table: Revenue Agility & EOL Cost Comparison (2025 Data)
| Factor | Traditional Stationary Build | BESS Container | Container Advantage | Source & Notes |
|---|---|---|---|---|
| Avg. Deployment Time (Greenfield) | 18 – 30+ months | 6 – 12 months | 50-70% Faster | Site-specific engineering & complex construction vs. plug-and-play (Wood Mackenzie 2025). |
| Time to First Revenue | Months 18-30+ | Months 6-12 | Earn revenue 12-24 months sooner | Direct link between deployment speed and revenue start (Lazard LCOS v12.0). |
| Expansion Timeline (Add 20MW) | 12 – 18 months (re-permitting, complex integration) | 3 – 6 months | 70-80% Faster | Modular design allows near drop-in additions (NREL 2025 Modular Storage Report). |
| EOL Decommissioning Cost ($/kWh) | 30 | 15 | ~40-50% Lower | Simplified disassembly & transport (Circular Energy Storage Report 2025). |
| Residual Value (2nd Life Potential) | Low (10-20% of new) – bespoke systems hard to repurpose | Moderate-High (25-40% of new) – standardized modules desirable | Significantly Higher Asset Recovery | Secondary markets demand uniformity (BloombergNEF Battery Second-Life Markets 2025). |
| NPV Impact (100MW/400MWh Project) | Baseline | +10% to +15 | DECISIVE ADVANTAGE: CONTAINERS | Faster revenue + lower EOL costs + expansion potential boost NPV (Wood Mackenzie TCO Model 2025). |
Source Notes:
- Wood Mackenzie (2025): Their latest global deployment analysis confirms containerized BESS projects achieve commercial operation 50-70% faster than traditional builds, directly linking speed to earlier revenue capture and highlighting the NPV advantage of modular expansion. [Wood Mackenzie Energy Storage Deployment Tracker H1 2025]
- Lazard LCOS v12.0 (2025): Explicitly factors in the time value of money, showing projects generating revenue 12-24 months earlier significantly boost IRR and NPV, favoring containerized deployment. [Lazard’s Levelized Cost of Storage Analysis – Version 12.0]
- NREL (2025): Quantified the dramatic reduction in expansion timelines for modular container systems versus site-built, emphasizing minimal disruption and simplified interconnection. [NREL The Value of Modularity in Energy Storage Deployment 2025]
- Circular Energy Storage (2025): Detailed cost breakdowns show standardized containerized systems are significantly cheaper and easier to decommission and transport for recycling/repurposing. [CES Battery Decommissioning & Recycling Cost Report 2025]
- BloombergNEF (2025): Reports clear price premiums for containerized BESS modules in second-life markets due to predictable performance and easier integration compared to non-standard packs. [BNEF Battery Second Life: Pricing & Applications 2025]
Why Containers Own the Future (and the Past):
- Revenue Starts Yesterday: Getting connected 12-24 months faster means capturing millions in revenue from Day 1 frequency regulation, capacity payments, or energy arbitrage that traditional builds miss entirely. A 100MW project capturing just 25/kW−monthinancillaryservicesearns∗∗2.5 million per month**. 12 months early? $30 million head start.
- Expand on Demand, Not on Delay: Market opportunities shift fast. Containers let you add capacity in months, not years, capturing rising prices or new contracts without rebuilding the wheel. This agility is pure competitive advantage.
- EOL: Lower Costs, Higher Recovery: Avoid expensive demolition bills. Recover more value through simpler recycling or desirable second-life modules. It’s a responsible and financially smarter endgame.
- NPV: The Ultimate Scorecard: Combining drastically lower CAPEX, reduced OPEX, superior performance retention, faster revenue, and lower EOL costs, containers deliver a 10-15% higher Net Present Value (NPV) according to Wood Mackenzie’s 2025 TCO models. This is the financial mic drop.
The Undisputed Champion: Final TCO Verdict
Across all four rounds – CAPEX, OPEX, Degradation, and Revenue/EOL agility – BESS containers emerge as the undisputed, heavyweight champion of Total Cost of Ownership (TCO).
- Round 1 (CAPEX): Containers win by 30-50% lower upfront cost. (BloombergNEF, NREL)
- Round 2 (OPEX): Containers win by 35-40% lower annual operating costs. (NREL, Lazard, Marsh/GCube)
- Round 3 (Degradation): Containers win by TKO – delivering 3-4% higher efficiency and 25-30% slower degradation, preserving $7M+ per 400MWh project. (DOE, NREL, Wood Mackenzie)
- Round 4 (Revenue/EOL): Containers deliver the knockout – generating revenue 12-24 months sooner, enabling rapid expansion, reducing EOL costs by 40-50%, and boosting project NPV by 10-15%. (Wood Mackenzie, Lazard, CES, BNEF)
The Undisputed TCO Champion? Containers. The Data Doesn’t Lie.
The verdict is unequivocal. Independent 2025 analyses from BloombergNEF, Wood Mackenzie, NREL, and the DOE confirm: Over a 15-year lifecycle, containerized BESS delivers a decisive 30-45% lower Total Cost of Ownership compared to traditional stationary builds. This isn’t a marginal win; it’s a landslide victory built on:
- Radical CAPEX Reduction: 30-50% lower installed cost (BloombergNEF H1 2025).
- Streamlined OPEX: 35-40% lower annual operating costs (NREL, Lazard LCOS v12.0).
- Performance Preservation: 3-4% higher efficiency & 25-30% slower degradation, preserving $7M+ per 400MWh project (DOE, Wood Mackenzie).
- Revenue Acceleration: Generating cash flow 12-24 months sooner and enabling expansion in months, not years (Wood Mackenzie Deployment Tracker).
- Efficient EOL: 40-50% lower decommissioning costs & higher residual value (Circular Energy Storage, BNEF).
Cumulative Lifetime Savings (100MW/400MWh Project over 15 Years):
| Cost Category | Traditional Stationary | BESS Container | Net Savings | Source |
|---|---|---|---|---|
| CAPEX (Installation Focus) | 180M | 120M | 560M | BloombergNEF H1 2025 |
| OPEX (15 Years) | 108M | 65M | 43M | Lazard LCOS v12.0 |
| Value Lost to Degradation/Ineff. | ~$7.3M | ~$0M (Baseline) | +$7.3M Preserved | DOE/Wood Mackenzie 2025 |
| EOL Cost (Net Cost/Recovery) | 12M (Cost) | (2M)−6M (Potential Recovery) | 18M Advantage | CES/BNEF 2025 |
| Lost Revenue (Delayed Start/Expansion) | 30M (Opportunity Cost) | ~$0M (Baseline) | +15M−30M Captured | Wood Mackenzie NPV Model 2025 |
| Total Project Lifetime Cost/Savings | 330M | 191M | ~98M−139M SAVED | CONTAINER TCO ADVANTAGE: ~40-45% |
Source: Synthesis of major 2025 TCO studies: [BloombergNEF Energy Storage Market Outlook H1 2025], [Wood Mackenzie Energy Storage NPV & TCO Model 2025], [Lazard’s Levelized Cost of Storage v12.0], [DOE 2025 Grid Storage Value Report].

Why Maxbo Solar is Your Corner Man in This Fight
The TCO math is undeniable. At Maxbo Solar, we don’t just understand it – we engineer our solutions around it. We live and breathe intelligent energy storage, and our real-world project data mirrors the industry’s findings. That’s why the Maxbo PowerRoam™ Containerized BESS is engineered from the ground up to maximize your TCO advantage:
1. Plug-&-Profit Speed: Capture Revenue Faster
- Pre-Integrated & Pre-Tested: Factory acceptance testing ensures >99.9% commissioning success rate. [Maxbo Project Deployment Data 2025]
- Deployment Timeline: Achieve commercial operation in 6-9 months for greenfield sites – 60% faster than traditional builds. [Validated by Independent EPC Partners Q1 2025]
- Revenue Impact: Start earning from ancillary services and energy arbitrage 12-18 months sooner, adding 2M−4M+ per 100MW project in Year 1 cash flow. Based on avg. 2025 market prices.
2. TCO-Optimized Design: Maximize Lifetime Value
- Factory-Calibrated Thermal Management: Proprietary liquid cooling achieves < ±1.5°C cell temp variance, ensuring < 2.0%/year degradation and >91% RTE – outperforming industry averages. [Third-Party Test Report: DNV GL 2025]
- Standardized Components: Reduces maintenance costs by 15-20% vs. generic containers through optimized spares inventory & technician training. [Maxbo OPEX Benchmarking]
- Intelligent EMS: Maxbo SmartOS™ dynamically optimizes cycles for revenue and longevity, boosting lifetime throughput by 8-12%. [Algorithm validated by NREL Performance Modeling 2025]
3. Future-Proof Flexibility: Scale and Adapt Seamlessly
- Modular Expansion: Add 20MW increments in under 4 months – site works minimized, interconnection streamlined. [NREL Modular Storage Value Assessment 2025]
- Second-Life Ready: Standardized modules designed for easy repurposing, with residual values >30% of CAPEX projected by BNEF. [BloombergNEF Battery Second Life 2025]
- Grid Service Agility: Rapidly reconfigure software to capture evolving market opportunities (e.g., FDIR, Ramping).
4. Global Support, Local Expertise: De-Risk Your Investment
- Proactive Monitoring & Maintenance: Global NOC with predictive analytics reduces downtime by >30% vs. reactive models. [Maxbo Fleet Performance Data]
- Performance Guarantees: Industry-leading availability (>98.5%) and degradation warranties backed by Maxbo’s balance sheet.
- Financing Advantage: Projects using Maxbo PowerRoam™ secure financing 50-75 bps lower due to proven tech and lower perceived risk. [Major Project Finance Bank Tiers 2025]
| Strategy | Cost Avoidance | Revenue Opportunity |
|---|---|---|
| Second-Life Deployment | 200/kWh (vs. new BESS) | 60/kWh resale value |
| Closed-Loop Recycling | 50% lower lithium sourcing | $1.8B+ metal recovery market |
| Regulatory Compliance | 100% IRA credit eligibility | 22% higher ESG valuations |
Sources: BloombergNEF, 2025, McKinsey, “Battery EoL Economics”
The Bottom Line:
- 💰 Profit Motive: Companies with circular BESS programs achieve 15% higher margins by 2027 (IEA, 2025).
- 🌍 Planetary ROI: Every recycled 1MWh BESS unit = 12 tons of CO₂ saved—equal to 30,000 tree seedlings grown for 10 years (EPA WARM Model, 2025).
Final Thought:
Sustainable EoL isn’t greenwashing—it’s the ultimate leverage. While others dig graves, we build futures.