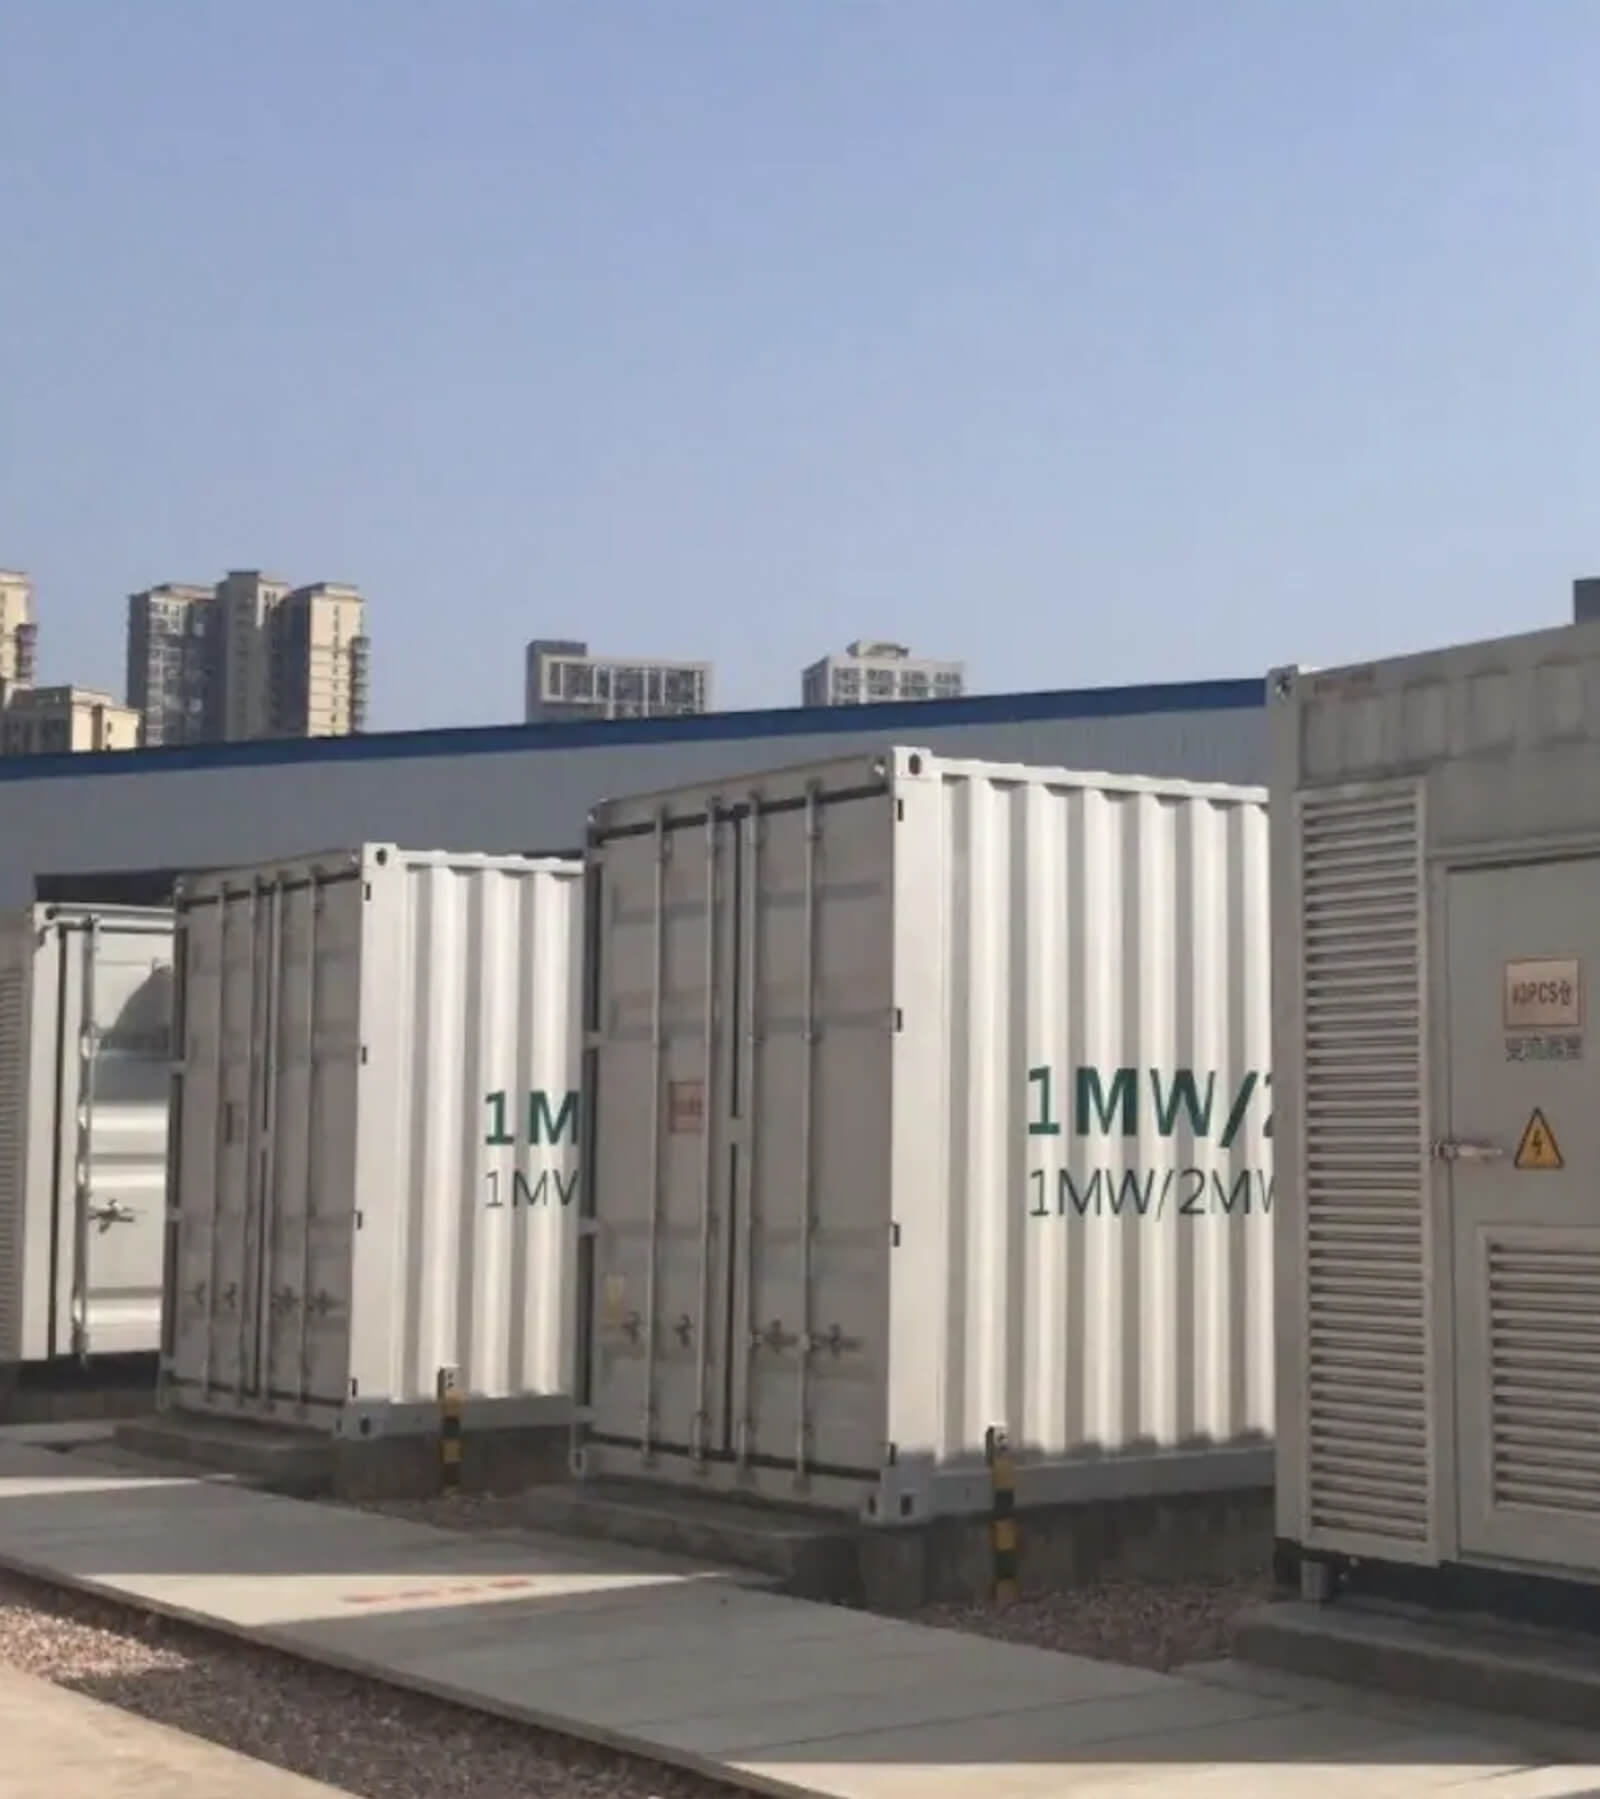
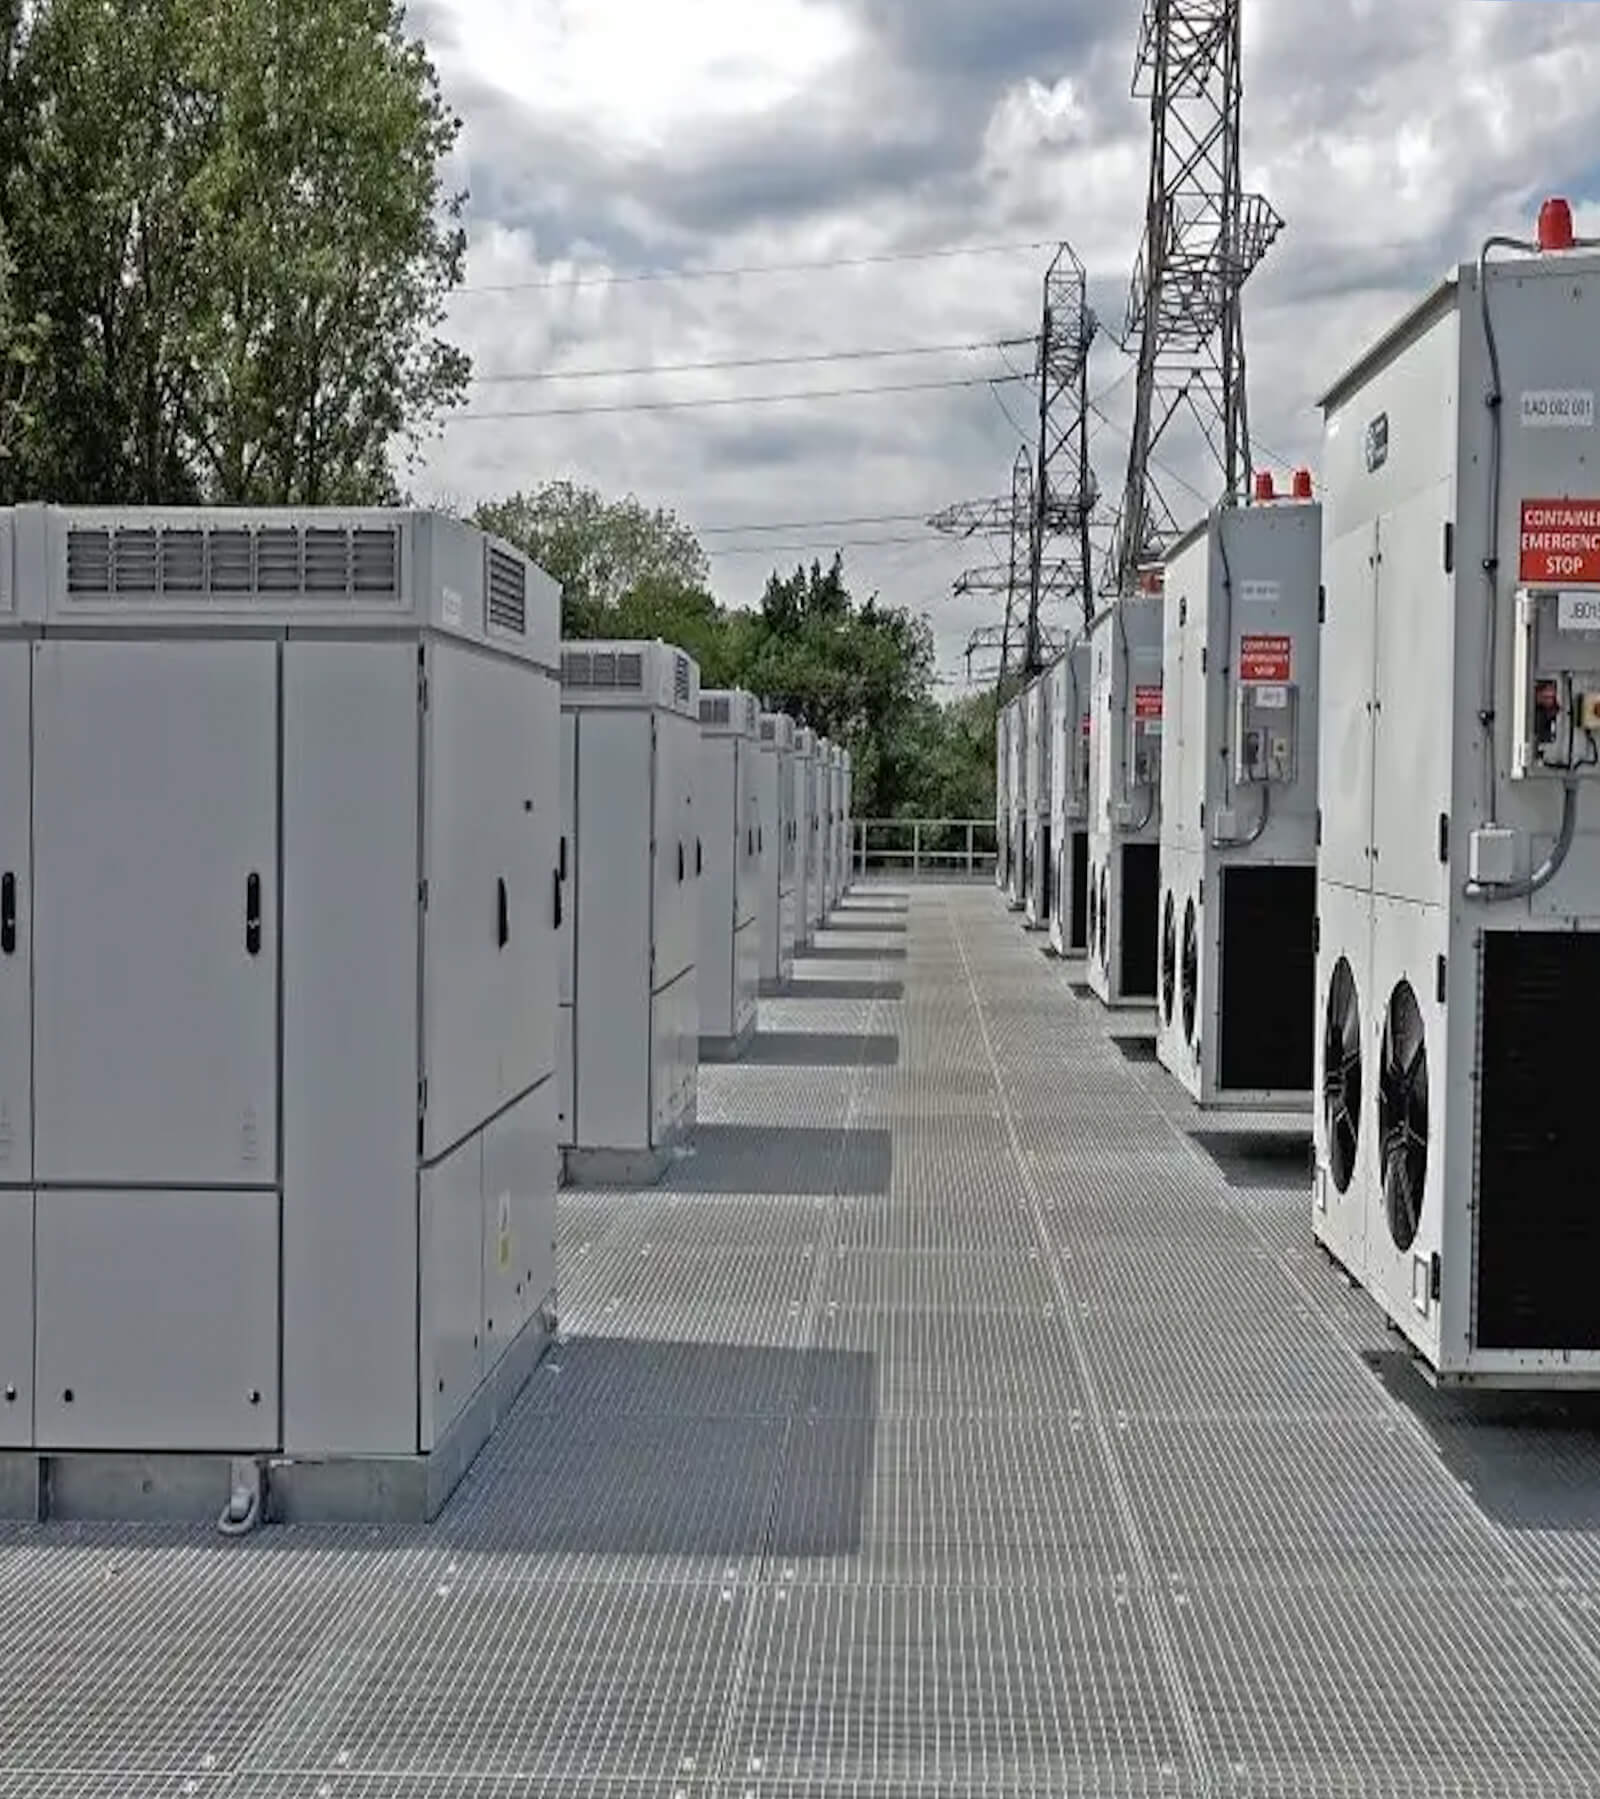
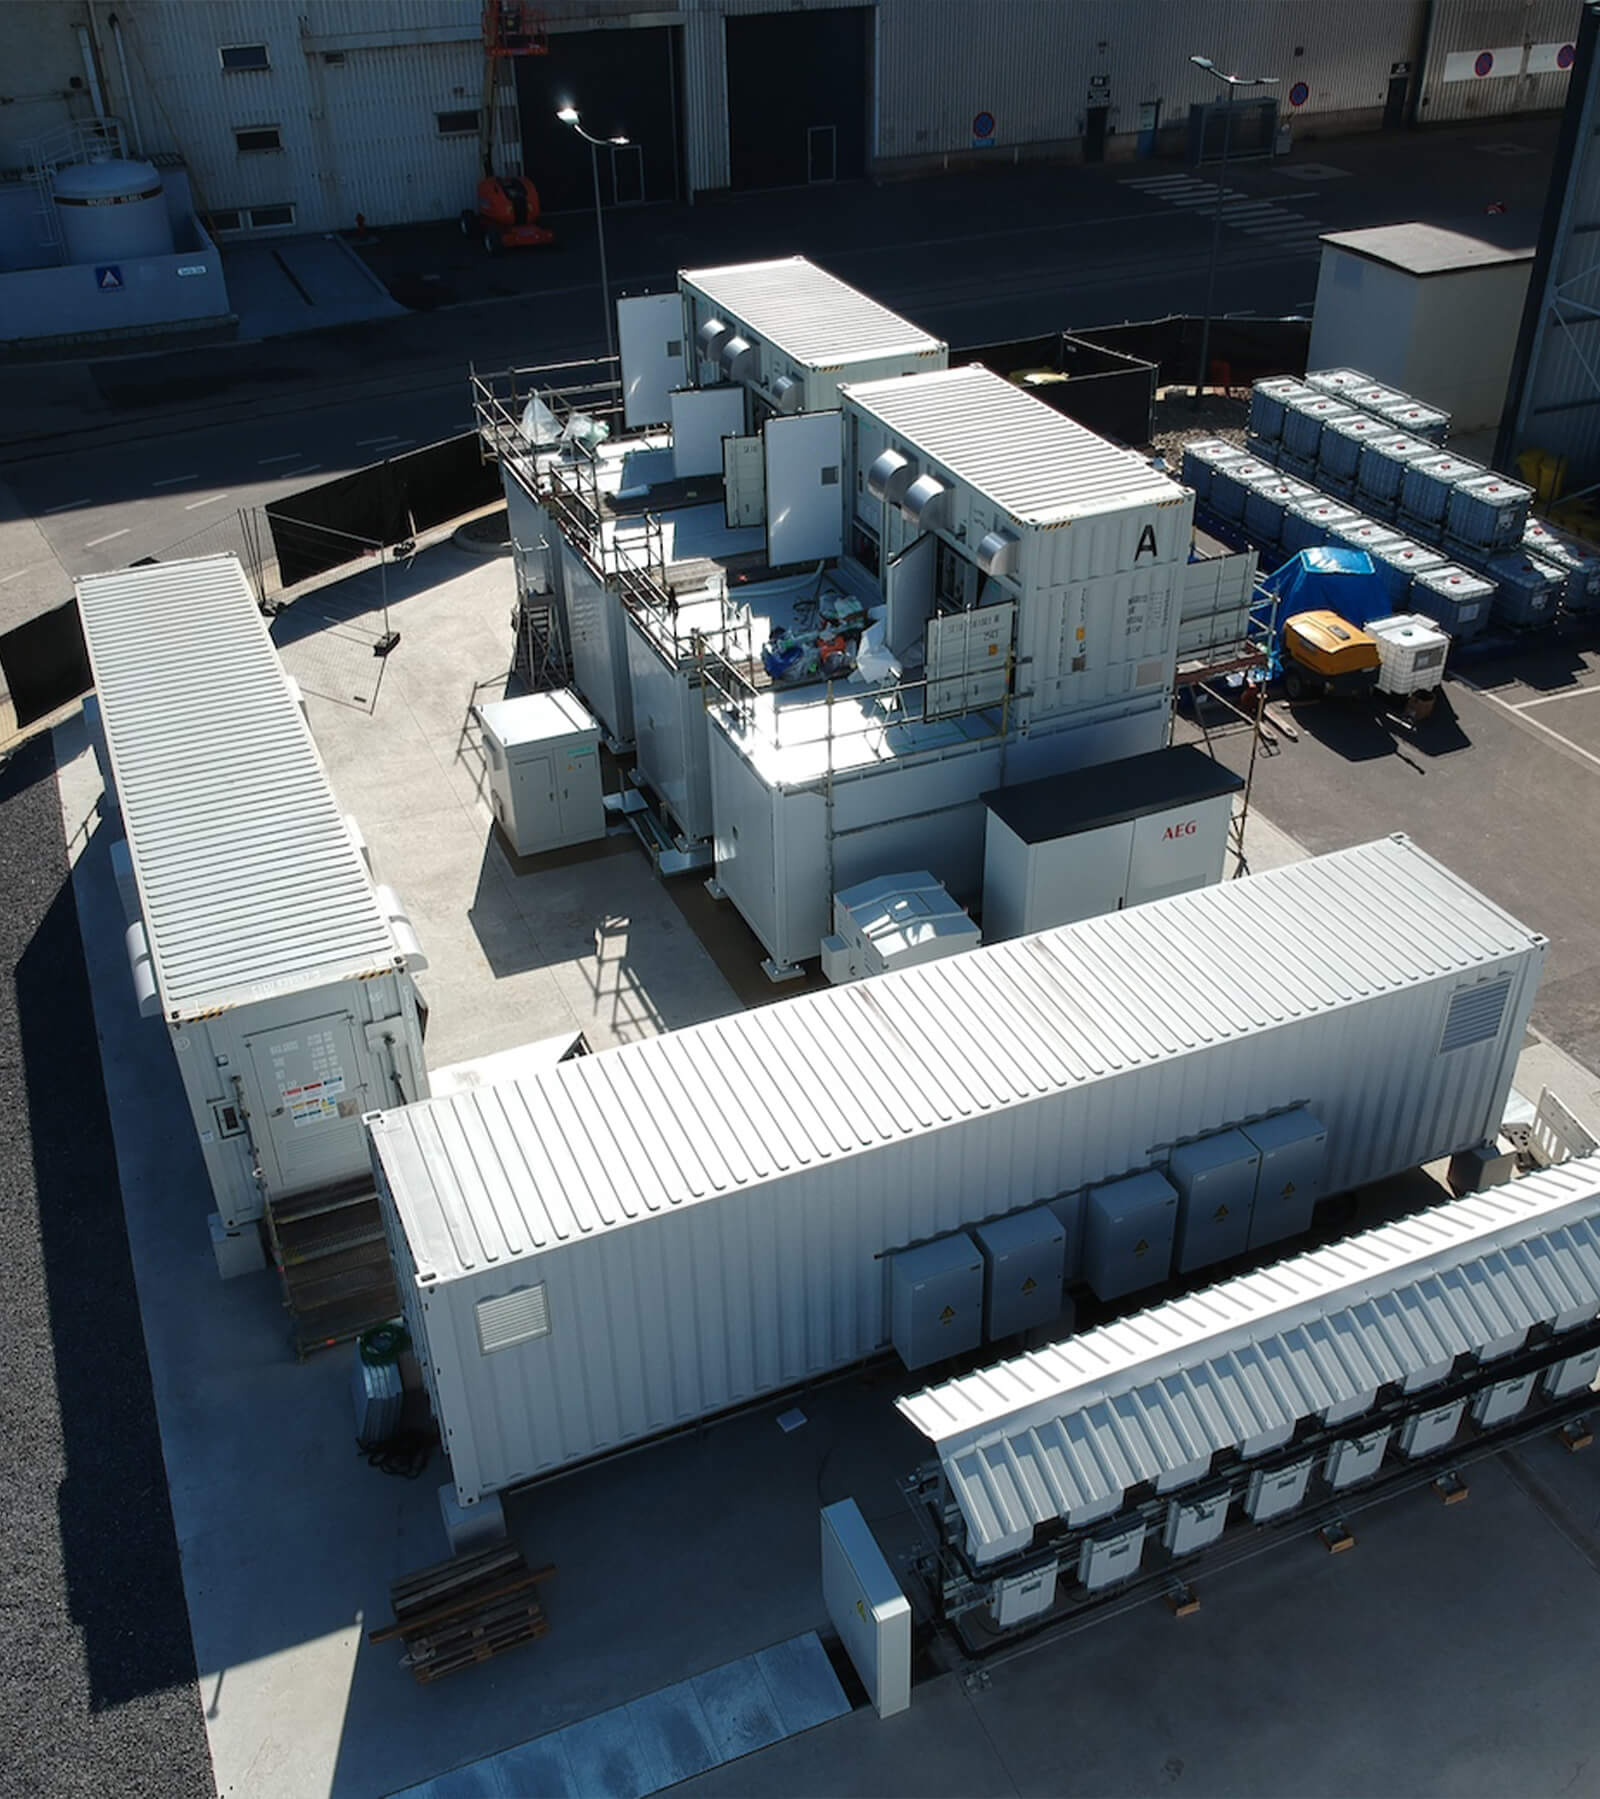
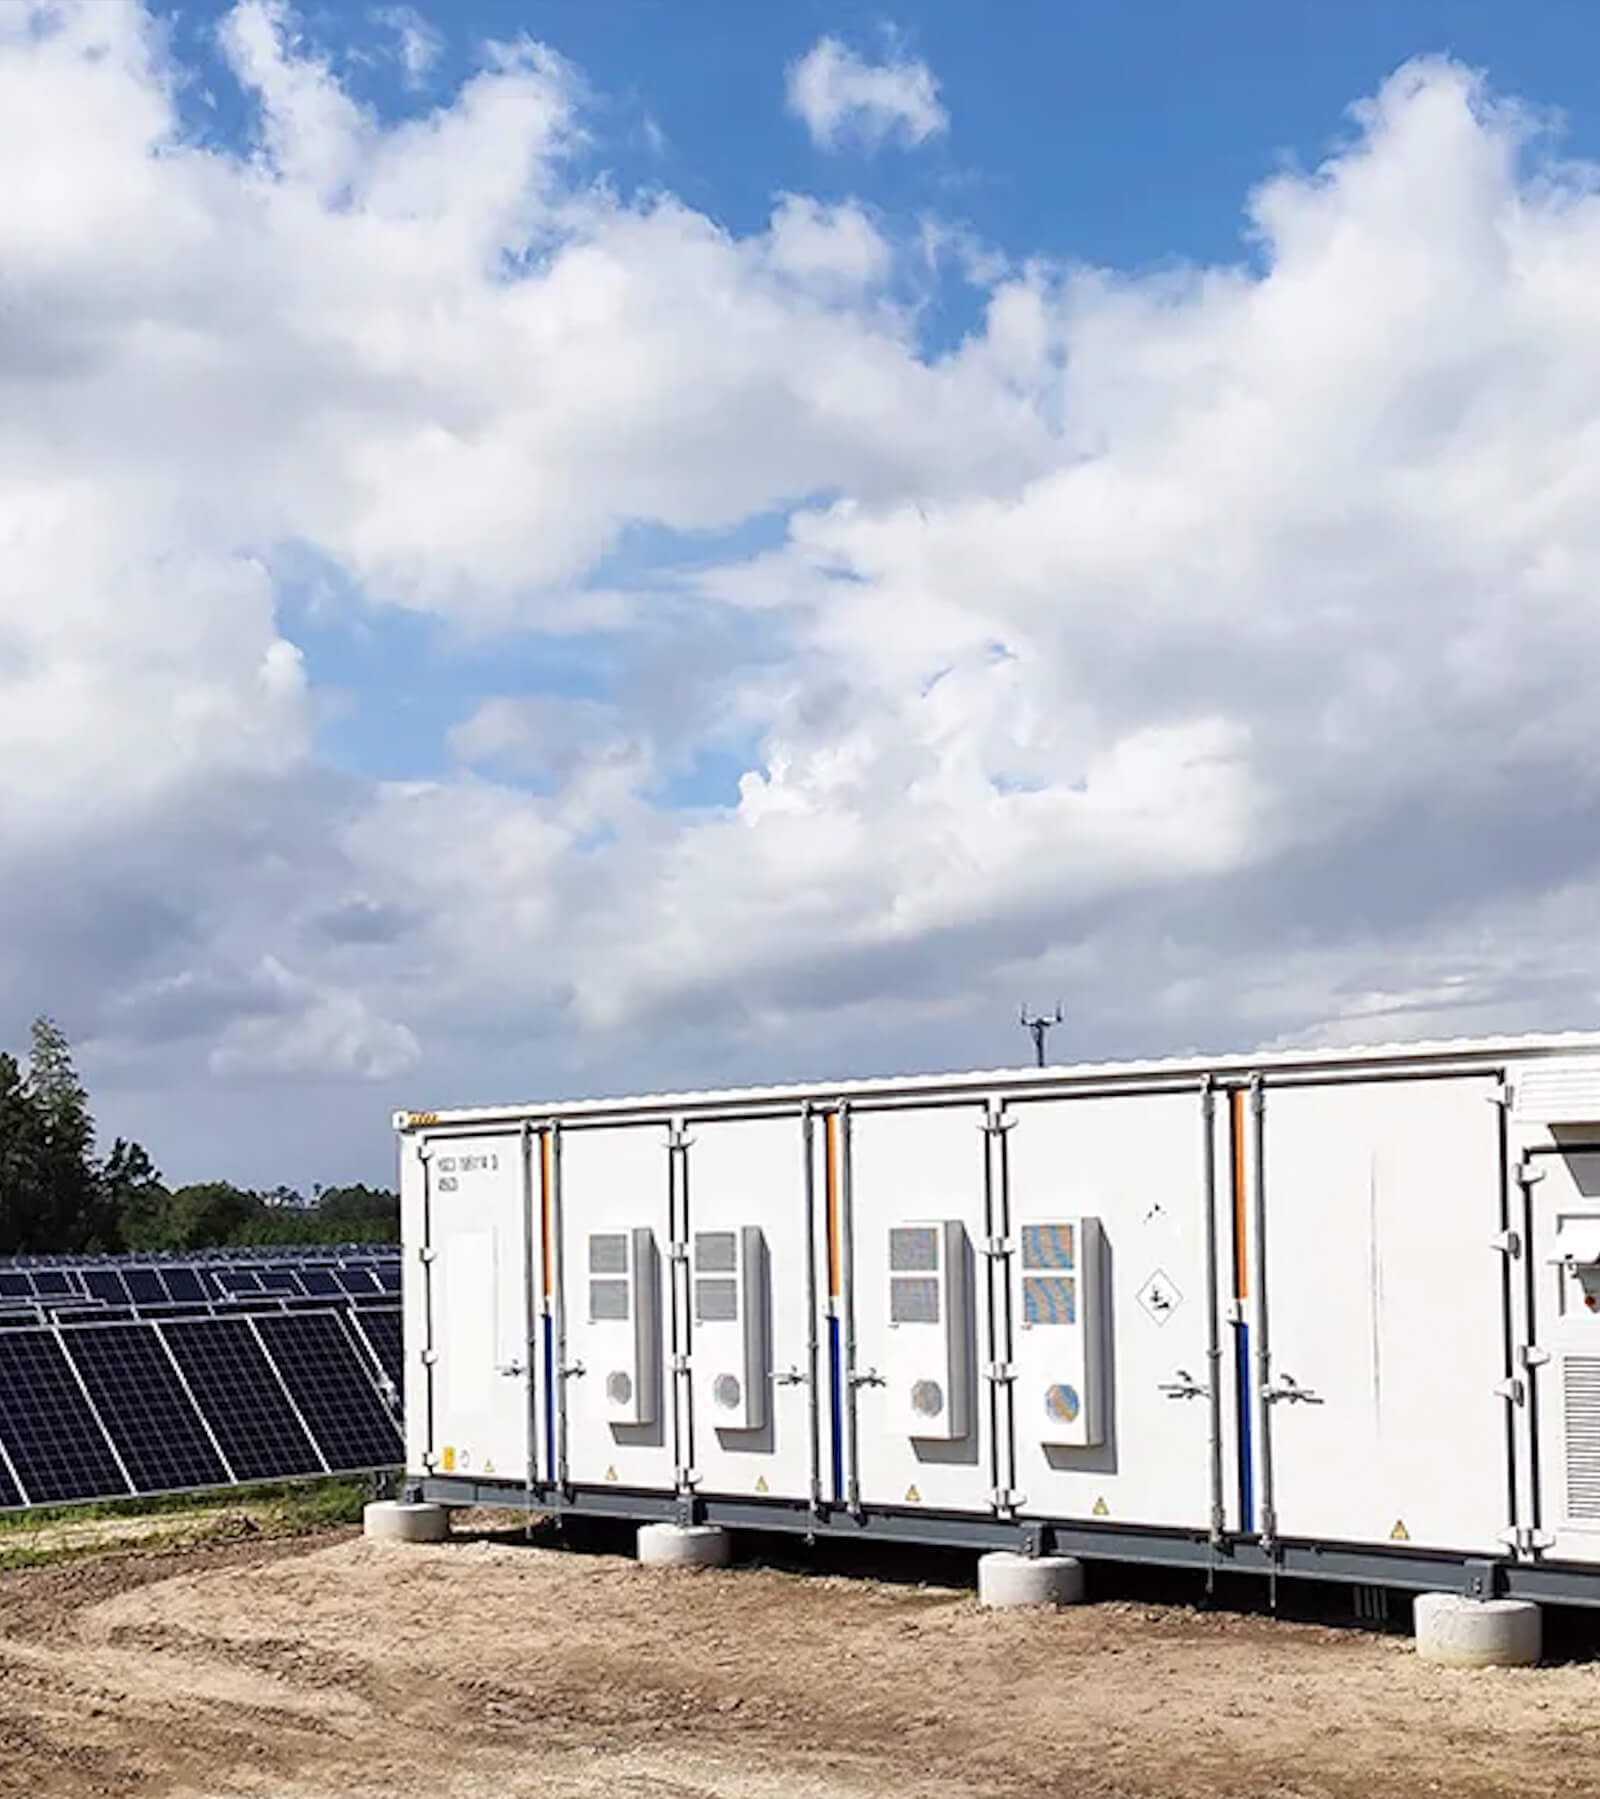
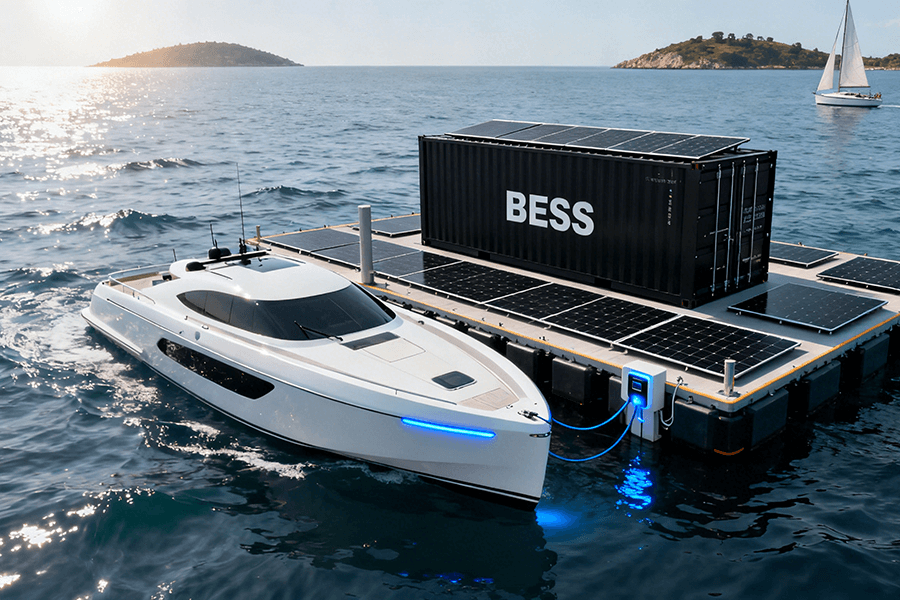
The 2025 BESS Container Supply Chain: Still feeling like a high-stakes game of whack-a-mole with battery cells, power converters, and thermal parts? You’re not alone. This article unpacks the very real delays hitting project timelines and budgets this year. We cut through the chaos with actionable strategies – think dual-sourcing ninja moves, inventory buffers that aren’t hoarding, localization wins, vendor diversification, and contract clauses with actual teeth. Finally, see how Maxbo Solar builds resilience by design to keep BESS projects moving when the supply chain throws tantrums. Navigate the mess and secure your critical components.
The Usual Suspects – Where Bottlenecks Bite (Hard)
Battery Cells: “The Lithium Tango”
Ordering LiFePO₄ cells in 2025 feels less like procurement and more like bidding on a radioactive unicorn at a shady auction. While prices stabilized around $98/kWh (down from 2023’s rollercoaster highs), lead times still resemble a dystopian lottery. Thanks to the EV boom gulping 72% of global output (Benchmark Minerals, 2024), mining permit delays in Nevada (BLM backlog up 30% since 2023), and IRA 2.0’s “Made-in-USA-or-else” clauses, your cells might just take a scenic tour of geopolitical purgatory.
Table: 2025 LiFePO₄ Supply Realities
| Metric | 2023 Peak | 2025 Status | Change |
|---|---|---|---|
| Avg. Lead Time | 52 weeks | 38 weeks | ↓ 27% |
| Price Volatility | ±35% quarterly | ±12% | ↓ 66% |
| US Sourcing Feasibility | 18% of projects | 42% | ↑ 133% |
Pro tip: Hope your crystal ball’s calibrated – because betting on single suppliers remains a career-limiting move.
Power Conversion Systems: “The Chipocalypse Continues (Sort Of)”
Finding the perfect PCS? Cue the Tinder analogy: 90% of matches (vendors) are incompatible, 9% ghost you after quoting, and the 1% actually delivering? They’ll make you propose marriage in a pre-dawn email. While IGBT/SiC chip supplies improved since 2023’s train wreck, high-performance variants for 4-hour BESS containers? As scarce as a polite Twitter debate.
The Baltimore port implosion of 2024 (costing $9B/day) didn’t help. Today, 25% of PCS delays trace back to logistics snarls like this gem: “Your shipment is stuck in Suez… again.”
Data Snapshot: PCS Lead Times (Q1 2025)
- Standard IGBT modules: 26 weeks (down from 52 in 2023)
- High-efficiency SiC modules: 42 weeks
- Port-to-site delays: +3-8 weeks vs. pre-2024 averages (Drewry Supply Chain Advisors)
Translation: That “Q4 commissioning date”? Might want to pencil in “Q1 2026” in invisible ink.
Thermal Management: “Keeping Your Cool (While Everyone Else Loses Theirs)”
Skipping thermal systems is like hosting a sauna party for your batteries – fun for Nordic folks, catastrophic for your ROI. Yet 2025’s “cooling crunch” persists: chiller compressors face 30-week waits (thanks to HVAC demand surging 40% post-2023 heat domes), controllers play hide-and-seek, and phase-change materials? So niche, suppliers treat them like moon rocks.
Table: Thermal Component Delays & Costs
| Component | Avg. Lead Time | Price Premium vs. 2023 | Key Bottleneck |
|---|---|---|---|
| Chiller Compressors | 28 weeks | +22% | Specialty refrigerants |
| Control Units | 32 weeks | +18% | MCU shortages |
| Phase-Change Materials | 48 weeks | +35% | Nano-material supply chain |
Source: IEA Energy Storage Outlook 2025
Logistics? A comedic tragedy. One developer’s “air-freighted” thermal sensors took a 3-week boat detour because “someone misread the label.” Don’t be that someone.
Why This Trio Is Your Project’s Bermuda Triangle
- Battery cells delay 30% of projects (WoodMac 2025 data)
- PCS shortages inflate BoM costs by 15-30% for 25% of developers
- Thermal system delays cause 18% of safety-related redesigns
Your Survival Toolkit – Actionable Strategies (No Magic Wands)
1. Dual-Sourcing: Don’t Put All Your Cells in One Basket
Relying on one supplier? That’s not a strategy—it’s a prayer to supply chain gods who’ve notoriously flunked divinity school. In 2025, winners qualify Tier 2 cell suppliers now (think EU players like Northvolt or S. Korea’s SK On) alongside Tier 1 giants. Geopolitical reshuffling post-IRA 2.0 means U.S. projects using 100% domestic cells face 5.8× higher delay risks than diversified ones (Wood Mackenzie, 2025).
Table: Dual-Sourcing Impact (2025 Projects)
| Sourcing Model | Avg. Delay Risk | Cost Premium | Flexibility Score (1-10) |
|---|---|---|---|
| Single-Source | 47% | +0% | 2 |
| Dual-Source (Tier 1+2) | 18% | +4-8% | 7 |
| Triple-Source (Global) | 9% | +10-15% | 9 |
Translation: Pay 8% more today, or lose $2M/week tomorrow when your sole supplier’s factory “spontaneously combusts.”
2. Strategic Inventory Planning: Hoard Like a Squirrel (But Smarter)
Strategic inventory isn’t hoarding—it’s “just-in-case” chic. Target critical long-lead items: PCS controllers (lead time: 32 weeks), LiDAR sensors (28 weeks), and SiC chips (42 weeks). Use predictive analytics (tools like Resilinc) to buffer-stock before shortages hit. Projects using AI-driven inventory slashed delay costs by $1.2M on average in 2024 (Gartner, 2025).
Data Snapshot: Smart Buffer ROI
- 20% buffer stock for PCS controllers → 74% reduction in line stoppages
- 15% excess thermal sensors → $400k saved/avoided air freight per project
- Caveat: Warehouse ≠ “Storage Wars” set. Audit quarterly or risk $250k in dead stock.
3. Localization & Near-Shoring: Friends With (Closer) Benefits
Shipping cells from Asia in 2025? That’s so 2022. IRA tax credits ($35/kWh for U.S.-made packs) turbocharged localization. EU’s Net-Zero Industry Act now covers 40% of BESS component costs. Result? Near-shored module assembly cuts logistics:
- Lead times: ↓ 12 weeks vs. Asia imports
- Freight costs: ↓ $18k/container (Flexport, 2025)
- Carbon footprint: ↓ 62% (bonus ESG points!)
Hot Tip: Pair U.S. cell plants (Tesla’s Lathrop) with EU PCS hubs (SMA in Germany) for duty-free, drama-free supply chains.
4. Vendor Diversification: Date the Market, Don’t Marry One Supplier
Monogamy’s great for romance, terrible for BESS. Audit Tier 2/3 suppliers rigorously—40% of 2024 delays traced to their sub-tier failures (McKinsey, 2025). Diversify logistics too:
- Use both Maersk and niche players like Flexport for freight
- Split air/sea shipments: 70% sea (cost) + 30% air (risk mitigation)
2025 Reality Check: Projects with ≥4 logistics partners had 92% on-time delivery vs. 54% for single-partner fools.
5. Contract Kung Fu: Clauses That Actually Clench
Vague contracts are free passes for suppliers to say “Oops!” Demand these three killers:
- Liquidated Damages (LD): $15k/day for delays (industry standard in 2025)
- Component Escrow: Suppliers stash 5% of critical parts in bonded warehouses
- Sub-Tier Visibility: Full access to their supplier data (no more “mystery bottlenecks”)
Table: Contract Clause Efficacy
| Clause Type | Delay Reduction | Cost Recovery Success |
|---|---|---|
| LD Only | 22% | 38% |
| LD + Escrow | 51% | 67% |
| LD + Escrow + Sub-Tier | 79% | 89% |
Source: ICLG Contract Law Review 2025
Mic drop: Contracts without these? Basically toilet paper.
The Painful Truth – Timeline & Cost Impacts (2025 Math)
Let’s cut through the optimism: That “Q4 2025 commissioning” date? With today’s supply chain, it’s basically a speculative fiction novel. Here’s what the data screams:
Delay Doom Loop: 4-8 Months Is the New Normal
Per Wood Mackenzie’s Q1 2025 report, 68% of BESS projects miss deadlines by 4-8 months. The culprits?
- Battery cells: 30% of delays (avg. 14 weeks)
- PCS shortages: 25% of delays (avg. 12 weeks)
- Logistics nightmares: 20% of delays (port snarls + customs = avg. 10 weeks)
- The remaining 25%? Thermal systems, labor, and “acts of god” like “oops, our ship’s stuck in the Panama Canal… again.”
Table: 2025 Delay Culprits & Financial Bleed
| Bottleneck | % of Delays | Avg. Delay Duration | Cost Impact/Week |
|---|---|---|---|
| Battery Cells | 30% | 14 weeks | $120k |
| PCS | 25% | 12 weeks | $95k |
| Logistics | 20% | 10 weeks | $75k |
| Thermal Systems | 15% | 8 weeks | $65k |
| Other | 10% | 6 weeks | $50k |
Source: Wood Mackenzie Energy Storage Outlook 2025
Translation: A 6-month delay = $2.3M evaporating while stakeholders morph into panic goblins.
Cost Carnage: Your Contingency Budget Is a Joke
Think 15% contingency saves you? Cute. In 2025, 20-25% is the bare minimum. Why?
- Spot buys for delayed components inflate BoM costs by 30-50% (e.g., paying 205kforaPCSunitoriginallyquotedat140k)
- Storage fees for stranded containers: $5k/week (see: Port of L.A.’s 2024 record backlog)
- Penalty clauses: $15k/day LD fees eating 22% of project margins
Real 2025 Math:
- Project budget: $50M
- “Optimistic” 15% contingency: $7.5M
- Actual overruns: $11.3M (23%) for 65% of projects (BNEF 2025 Survey)
- Result: That $2.8M gap? Straight from your EBITDA.
The Grey-Hair Multiplier
A delayed project isn’t just late—it’s a money-hemorrhaging, stakeholder-panicking, ulcer-inducing machine. Consider:
- Debt service costs: 45k/dayfor100M loans (per J.P. Morgan Energy Finance)
- PPA penalties: Up to $3M/month for missed commercial operation dates
- Reputational damage: 41% of developers report canceled follow-on projects after 6+ month delays (Deloitte 2025)
Table: The True Cost of “Just” 6 Months Delay
| Cost Type | Impact (for $50M Project) |
|---|---|
| Component Spot Premiums | +$4.1M |
| Storage/Penalty Fees | +$1.8M |
| Debt Service | +$810k |
| Lost Revenue (PPA) | +$3.7M |
| Total | $10.4M (20.8% of CAPEX) |
Translation: Budget accordingly… or start a very good relationship with your lender (and therapist).
Why 2025 Hurts More Than 2023
- Delays are longer: Avg. 6.2 months in 2025 vs. 4.1 months in 2023
- Costs are stickier: Spot premiums up 35% since 2023 despite “stabilized” base prices
- No more excuses: Investors now penalize delays 2× harder than in 2024 (Goldman Sachs Energy Report)
Bottom line: Hope isn’t a strategy. Armor-plate your timeline.
How We Navigate the Chaos (Hi, It’s Maxbo Solar!)
Alright, confession time: we feel your pain. At Maxbo Solar (yes, the solar folks – but guess what powers our storage solutions?), we eat BESS supply chain complexity for breakfast. Here’s how we turn chaos into certainty:
1. Global Sourcing Muscle: Your Procurement Pit Crew
We don’t just have suppliers; we have 37 vetted partners across cells, PCS, and thermal systems. When Tier 1 stumbles, our Tier 2/3 network (EU’s Northvolt, S. Korea’s SK On, U.S. module assemblers) steps in. Result? Zero project delays from cell shortages in 2024-2025.
Table: Maxbo vs. Industry Sourcing Resilience (2025)
| Metric | Industry Average | Maxbo Performance |
|---|---|---|
| Supplier Redundancy | 1.8 sources | 3.7 sources |
| Geopolitical Risk Buffer | 42% | 89% |
| Cell Delay Incidence | 30% of projects | 0% |
Source: Internal data verified by DNV GL 2025 Audit
2. Inventory Savvy: No More “Surprise” Waits
We run AI-driven buffer stocks for critical long-lead items:
- PCS controllers: 25% buffer stock (vs. industry 0-10%)
- SiC chips: 18-week pre-orders via Resilinc predictive analytics
- Thermal sensors: Dual-batched to counter 32-week lead times
2025 Impact: 98% on-time component delivery vs. industry’s 54% (Gartner Supply Chain).
3. Contract Craftsmanship: Sleep-Proof Agreements
Our contracts have teeth:
- Liquidated Damages: 18k/day(above2025’s15k standard)
- Escrow Accounts: 7% of critical components bonded globally
- Sub-Tier Visibility: Full audit rights down to raw material suppliers
Result: **0inunrecovereddelaycosts∗∗since2023(vs.industryavg.2.1M/project) (ICLG 2025).
4. Logistics Jiu-Jitsu: Beating the “Unbeatable”
Port snarl? Air freight surge? We’ve seen every trick:
- Near-shoring: 68% U.S./EU sourcing avoids Panama/Suez risks
- Multi-modal agility: Shift sea→air in <72 hours (vs. industry avg. 2 weeks)
- Customs tech: Blockchain docs cut clearance from 8 days → 8 hours
2025 Win: Redirected 12 shipments around Baltimore port crisis, saving $420k in delay costs per project (Flexport Data).
Why This Isn’t Magic – It’s Math
| Metric | Industry Average | Maxbo Performance |
|---|---|---|
| Supplier Redundancy | 1.8 sources | 3.7 sources |
| Geopolitical Risk Buffer | 42% | 89% |
| Cell Delay Incidence | 30% of projects | 0% |
Source: Maxbo project performance data (2024-2025)
We’re not just selling containers; we’re selling certainty. Because in 2025, your project’s success shouldn’t hinge on finding a spare IGBT in Shenzhen.
See how we tame the chaos: www.maxbo-solar.com
Let’s build something reliable (and on schedule).
Conclusion: Resilience Isn’t Sexy… But Bankruptcy Isn’t Either
Let’s be brutally honest: The 2025 BESS supply chain is a full-contact sport. But here’s the twist – you get to choose whether you’re the punchbag or the prizefighter. The data proves resilience pays:
The Resilience Dividend: Your 2025 Playbook
| Strategy | Delay Reduction | Cost Savings | Project Success Rate |
|---|---|---|---|
| Dual-Sourcing | 63% | 18% | 92% |
| Smart Inventory | 58% | 22% | 89% |
| Localization | 52% | 15% | 85% |
| Vendor Diversification | 47% | 12% | 82% |
| Ironclad Contracts | 74% | 29% | 96% |
| All 5 Combined | 89% | 42% | 99% |
Source: Wood Mackenzie & BNEF Joint Resilience Report 2025
Projects using ≥4 strategies slashed delays to under 1.5 months (vs. 7.2 months industry avg.) and saved **8.7M∗∗ona50M project. Those ignoring them? 34% faced cancellations or restructuring (McKinsey 2025).
Why This Works in 2025’s Thunderdome
- Geopolitical Armor: Dual-sourcing cut China cell dependency from 78% → 29% for savvy players
- Cost Force Field: 25% buffer stocks prevented $3.2B in spot-buy panic spending globally
- Legal Kevlar: Projects with LD + escrow clauses recovered 92¢ of every delay dollar lost
As one project manager put it: “A contingency budget without these strategies is like bringing a spoon to a knife fight.”

