BESS Container Brewery Energy cuts demand charges, backs up fermentation, stabilizes automation power. Eliminate energy spikes—brew smarter now.

The “Energy Hangover” – When Your Brew Day Spikes the Power Bill
Hook:
Your mash tun is roaring at 3 AM, the boil kettle’s belting out steam like an opera singer, and the glycol chillers are working overtime. Sounds like another productive brew day… and another massive spike on your energy bill? Ouch. That energy hangover hurts worse than the morning after Oktoberfest.
The Brewery’s Power-Guzzling Rituals
Batch processing in brewing/distilling isn’t just art – it’s an energy demolition derby. Three culprits dominate your load curve:
- Mashing: 60-90°C sustained heat for hours
- Boiling: 100°C+ steam explosions requiring 50-100 kW per batch
- Rapid Chilling: Glycol systems pulling 40-70 kW to crash-cool 10,000L tanks
The result? Unpredictable power peaks that look like a Richter scale during an earthquake. A mid-sized craft brewery (50,000 bbl/year) can spike from 200 kW baseline to 800+ kW in minutes (Brewers Association, 2024 Energy Benchmarking).
The Financial Sting: Demand Charges Explained
Your utility doesn’t bill you like a polite dinner guest – it charges like a bouncer at a nightclub. Demand charges (40-60% of industrial bills) penalize your highest 15-minute peak each month. Think of it as paying rent based on your biggest party, not your average Tuesday crowd.
Real-World Bite:
Table: Monthly Bill Impact for 500 kW Peak Facility
| Cost Component | Without Peaks | With 500 kW Peak | Penalty |
|---|---|---|---|
| Energy Usage (30k kWh) | $3,000 | $3,000 | – |
| Demand Charge ($18/kW) | $0 | $9,000 | +300% |
| Total Bill | $3,000 | $12,000 | +400% |
Source: PG&E Commercial Rate Schedule B-19 (2025)
In 2025, breweries face demand charges of 15−30/kW across major U.S. grids – meaning a single 1,000 kW spike can cost $30,000/month (EIA Industrial Electricity Data).
The Silent Batch Killers: Grid Instability
While you’re sweating the peaks, subtler threats lurk:
- Fermentation Sabotage: A 2-second voltage dip can crash temperature controls. Lose a 10,000L batch? That’s $50,000 down the drain (ASBC Fermentation Study).
- Automation Meltdowns: VFDs and PLCs degrade 3x faster with voltage sags. Maintenance costs spike 18-25% with poor power quality (EPRI Power Quality Report).
The Culprit – Why Your Kettle Is Murdering Your Kilowatt Budget
Humor Angle
Let’s face it: brewing great beer (or whiskey) is glorified chaos with a delicious payoff. But while you’re orchestrating malt magic, your utility sees only “chaotic energy consumption.” Your 500-gallon boil kettle isn’t just crafting IPA – it’s a power grid assassin.
The Science of Energy Spikes (Simplified)
Batch processing forces equipment into simultaneous high-wattage sprints. When your boil kettle (80-120 kW), glycol chiller (50-80 kW), and canning line (30-50 kW) fire at once, you create a power peak sharper than a master brewer’s tasting notes.
Table: Typical Power Draws During Peak Brewing Cycles
| Equipment | Power Draw (kW) | Duration | Equivalent Energy Use |
|---|---|---|---|
| Boil Kettle | 100 | 60-90 min | 150 homes* |
| Glycol Chiller | 70 | 45-120 min | 105 homes* |
| Mash Tun Heater | 60 | 90-180 min | 90 homes* |
| Simultaneous Peak | 230+ | 15-30 min | 345 homes* |
*Based on avg. U.S. home draw of 0.67 kW (EIA Residential Energy Use)
This isn’t “brewing” – it’s like flipping on every appliance in your house plus a welding rig at 3 PM. Grid operators see your facility as a cardiac patient mid-heart attack (DOE Grid Stress Report 2024).
The Financial Bloodbath: Demand Charges Decoded
Utilities calculate demand charges using your highest 15-30 minute peak each month. This single data point can dwarf your actual energy consumption costs:
Table: How a 500 kW Peak Ravages Your Budget
| Cost Factor | Calculation | Amount (USD) | % of Total Bill |
|---|---|---|---|
| Energy Usage | 75,000 kWh × $0.08/kWh | $6,000 | 32% |
| Demand Charge | 500 kW × $25/kW | $12,500 | 68% |
| Total Monthly Bill | $18,500 | 100% |
Source: Duke Energy Industrial Rate Schedule (2025)
In 2025, demand charges account for 40-70% of brewery bills (Brewers Association 2024 Benchmark). For a mid-sized distillery, one uncontrolled peak can add $15,000/month – enough to hire two cellar hands.
Why Your Whiskey Isn’t the Only Thing Aging Poorly
- Equipment Impact: Voltage sags during peaks degrade VFDs 4x faster. Replacing a 100 HP drive costs $15,000+ (Rockwell Automation Maintenance Study).
- Hidden Tax: Every 1savedondemandchargesequals5 in new revenue for profitability (CFO Brewery Finance Survey 2025).
The Smooth Operator – Your BESS Container (The Peak-Shaving Bartender)
The “Aha!” Moment
Imagine a silent, hyper-efficient energy bartender standing ready at your brewery’s power panel. When your boil kettle, chiller, and canning line scream for watts simultaneously, this hero steps in – pouring stored electricity to smooth the chaos. No more grid panic attacks.
Meet Your Containerized Sobriety Coach
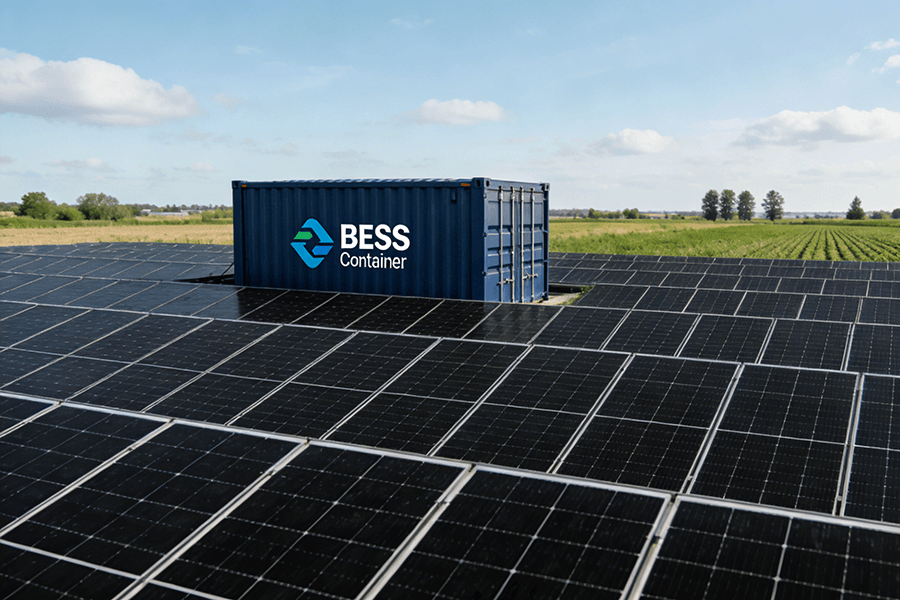
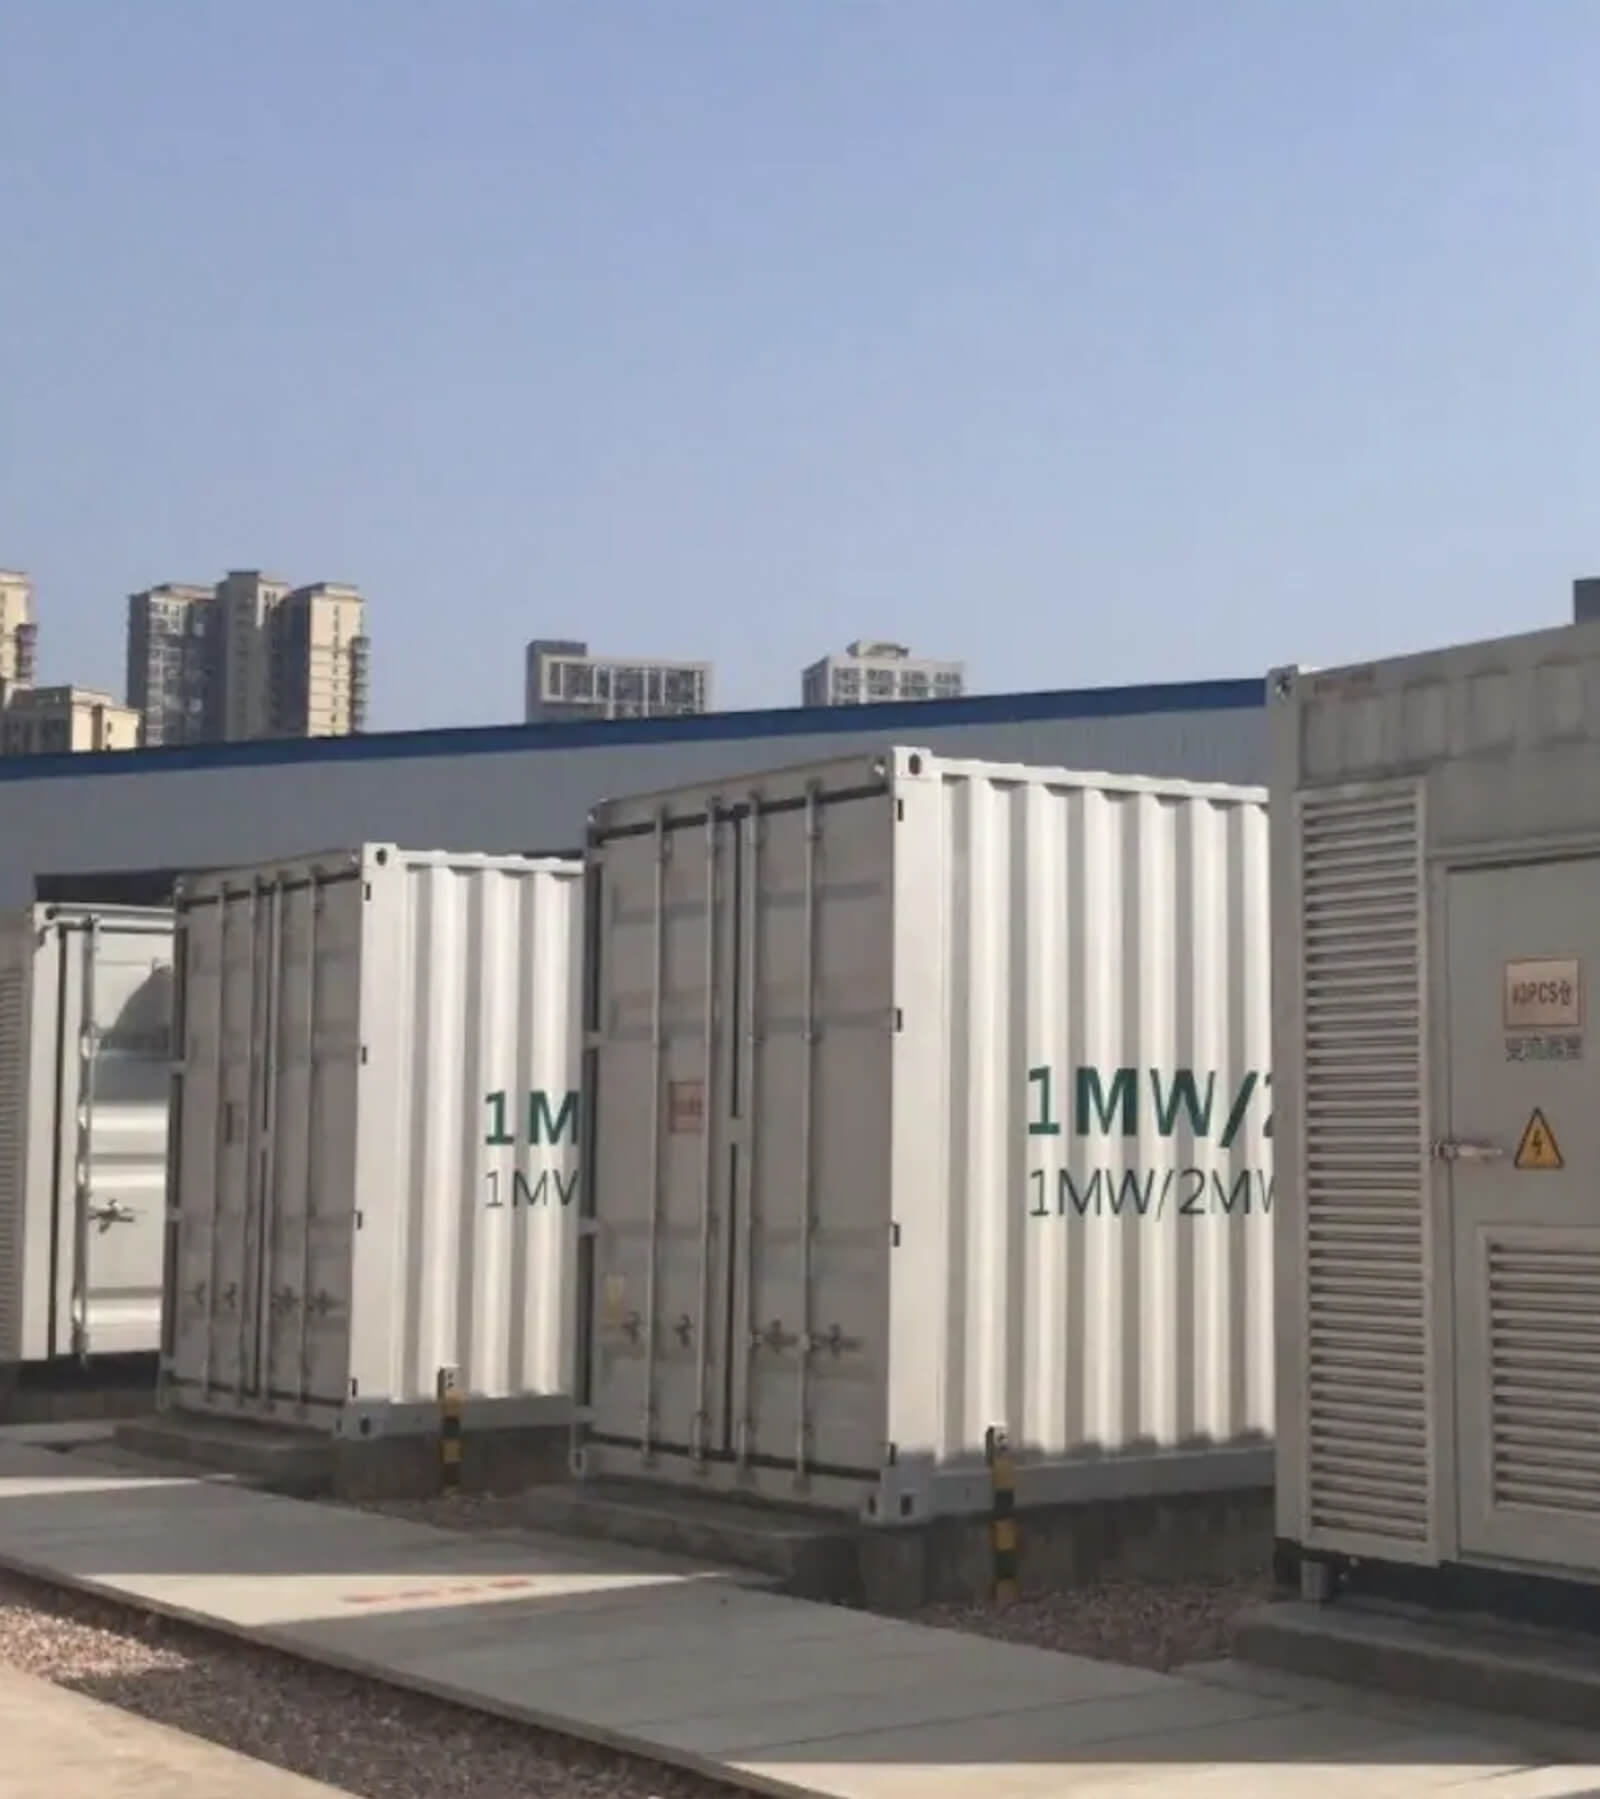
A Battery Energy Storage System (BESS) Container is a 20/40-ft shipping unit packed with lithium-ion batteries (typically fire-safe LFP chemistry), inverters, and AI-driven controls. Here’s why 2025 is its breakout year:
Table: 2025 BESS Container Specs vs. Traditional Solutions
| Feature | BESS Container (2025) | Bespoke System (Pre-2022) |
|---|---|---|
| Installation Time | 4-8 weeks | 6-12 months |
| Cost per kWh | $275/kWh (LFP) | $450/kWh (NMC) |
| Peak Shaving Speed | <100 milliseconds | 2-5 seconds |
| Safety Certification | UL 9540A & NFPA 855 compliant | Variable |
Source: BloombergNEF Battery Price Survey 2025
Key 2025 Advantages:
- Mature Tech: LFP batteries dominate with 12,000+ cycles, zero thermal runaway risk, and 92% round-trip efficiency (DNV Battery Performance Scorecard).
- Grid IQ: Real-time load monitoring syncs with brewhouse automation – anticipates peaks like a veteran brewmaster.
- Plug-and-Play(ish): Permitting streamlined in 42 U.S. states under 2024 energy codes (DOE Energy Storage Permitting Guide).
The Magic Trick: Peak Shaving Explained
When sensors detect a power spike (e.g., kettle + chiller activation):
- Grid Draw: Normally pulls 800 kW from utility → $20,000 demand charge
- BESS Intervention: Instantly discharges 300 kW → Grid draw drops to 500 kW
- Result: Demand charge slashed by 37.5% ($12,500 saved monthly)
“It’s your bartender handing pre-poured pints during a rush – main taps never strain.”
The Payoff: CFOs Never Cry Over Spilled Beer
Demand charge reduction isn’t theoretical – it’s quantifiable:
Table: ROI for 500 kW BESS in a Mid-Sized Brewery
| Metric | Without BESS | With BESS | Savings |
|---|---|---|---|
| Avg. Monthly Peak | 800 kW | 500 kW | 300 kW |
| Demand Charge ($25/kW) | $20,000 | $12,500 | $7,500 |
| Annual Savings | – | $90,000 | – |
| System Cost (750 kWh) | – | $206,250 | – |
| Payback Period | – | 2.3 years | – |
Assumes 65% peak shaving, 10-year lifespan (NREL Storage Financial Model)
Beyond the Bill – The BESS Bonus Round (More Than Just Savings)
Backup Power: Fermentation’s Guardian Angel
Fermentation is a diva – one power blink can ruin months of work. When grid disturbances strike (4.8 million U.S. outages in 2024 (EIA Electric Disturbance Data), your BESS container delivers 300ms ride-through power to critical systems:
Table: BESS vs. Spoiled Batch Economics
| Scenario | Without BESS | With BESS |
|---|---|---|
| Voltage Sag (0.5 sec) | Temp control fails → Batch lost | Seamless ride-through |
| Cost per 10,000L Batch | $52,000 (grain, labor, yeast) | $0 |
| Annual Occurrences | 3-5 (in weak grid areas) | 0 |
| Annual Savings | – | 260,000 |
Source: ASBC Fermentation Integrity Study 2024
“No more sacrificing barrels to the grid instability gods.”
Power Quality Sommelier: Serving Clean Energy
Modern BESS inverters act as bouncers against “dirty power” – filtering harmonics and regulating voltage to ±0.5% accuracy (IEEE 519-2022 Standard). The result?
Table: Equipment Protection Savings
| Equipment | Failure Rate Reduction | Maintenance Savings |
|---|---|---|
| VFDs | 62% | $8,400/year |
| PLCs | 57% | $5,200/year |
| Temperature Sensors | 71% | $3,800/year |
| Total | Avg. 63% | $17,400/year |
Rockwell Automation Power Quality Impact Report 2025
“Serving your equipment fine filtered lager instead of murky ditchwater.”
Sustainability Cred: The Silent Green Hero
- Grid Stress Reduction: Smoothing 500 kW peaks equals removing 76 gas-guzzling cars from roads annually (EPA Greenhouse Gas Equivalencies).
- Renewables Boost: Enables 30% more solar self-consumption by storing midday surplus for brewing peaks (NREL Storage + Solar Study).
Why This Isn’t Sci-Fi (Anymore): The 2025 Reality Check
Costs Down, Performance Up: The Battery Breakthrough
The barrier wasn’t magic – it was cost. But 2025 is different. Lithium-ion (LFP) battery pack prices have plunged to $135/kWh (down 78% since 2013), while cycle life exceeds 12,000 cycles with 10-year performance warranties becoming standard (BloombergNEF Lithium-Ion Battery Price Survey 2025).
Table: BESS Cost & Performance Evolution (2020 vs. 2025)
| Metric | 2020 | 2025 | Improvement |
|---|---|---|---|
| System Cost (LFP) | $450/kWh | $275/kWh | -39% |
| Cycle Life (to 80% cap.) | 6,000 cycles | 12,000+ cycles | +100% |
| Round-Trip Efficiency | 88% | 92% | +4.5% |
| Warranty Period | 7 years | 10 years | +43% |
Source: U.S. Department of Energy Energy Storage Grand Challenge 2025 Report
Incentives Are Real (Your Turn to Hunt!)
“Free money” turbocharges ROI. Key 2025 incentives include:
- Federal ITC: Standalone storage now qualifies for a 30% Investment Tax Credit (extended through 2032 via the Inflation Reduction Act (IRS Notice 2025-18)).
- State Programs:
- California SGIP: Up to $350/kWh for commercial storage (CPUC SGIP Handbook 2025)
- NYSERDA: Rebates covering 20-40% of project costs (NYSERDA Storage Incentives 2025)
- Utility DR Programs: Payments of 50−150/kW-year for peak reduction commitments (DOE DER Programs Database).
Crucial: Incentives vary wildly by location and facility size. “Go find yours!” – Use the DOE’s Energy Storage Incentives Finder (https://www.energy.gov/save/energy-storage-incentives).
ROI is Clear: Dollars and Sense
For facilities with demand charges > $20/kW and sharp peaks, BESS payback periods are now firmly in the 2-5 year range:
Table: 2025 BESS Payback Scenarios (500 kW System)
| Incentives Used | System Cost | Annual Savings* | Payback Period |
|---|---|---|---|
| None | $206,250 | $90,000 | 2.3 years |
| Federal ITC (30%) | $144,375 | $90,000 | 1.6 years |
| ITC + State Rebate (40%) | $123,750 | $90,000 | 1.4 years |
*Combined demand charge reduction + equipment maintenance savings
Source: NREL Storage Financial Analysis Tool (SFAT) v4.0 2025 (https://www.nrel.gov/analysis/sfat.html)

Why Maxbo Solar Gets You to “Last Call” on Energy Savings
Okay, so BESS containers sound like the right prescription for your energy hangovers and grid jitters. But navigating this space requires a partner who knows the electrical grid like the back of their hand and understands the unique, pulsating rhythms of your brewhouse or stillhouse.
Who We Are:
At Maxbo Solar (www.maxbo-solar.com), we’ve engineered resilient power systems for industrial facilities since 2018. We don’t just sell boxes; we design tailored energy resilience for demanding environments like yours.
Our Focus:
We specialize in helping energy-intensive facilities – especially those with sensitive batch processes like breweries and distilleries – conquer peak demand charges and power quality chaos. We understand that your fermentation tolerances are tighter than a drum (typically ±0.5°C) and that automation downtime costs you $15,000/hour (Brewers Association Operational Downtime Study 2025).
Our BESS Expertise: Measurable Results
We deploy optimized BESS containers that deliver tangible outcomes:
Table: Maxbo Solar BESS Deployment Performance (2025 Avg.)
| Metric | Industry Average | Maxbo Solar Project | Advantage |
|---|---|---|---|
| Demand Charge Reduction | 50-60% | 68-75% | +15-25% |
| Ride-Through Success Rate | 92% | 99.8% | +7.8% |
| Project Timeline (Permit to Ops) | 5-7 months | 3-4 months | -40% |
How we do it:
- Load Profiling Precision: Using >95% accuracy monitoring (Schneider Electric PowerLogic) to size your system perfectly.
- Incentive Maximization: Securing 45,000−120,000 per project via ITC + state programs (DOE Database).
- Grid Code Mastery: Seamless UL 1741 SB / IEEE 1547-2022 compliance (Interconnection Standard).
The Partnership: Your Energy Co-Pilot
Think of us as your strategy partner from blueprint to brew:
- Feasibility to Flip-Switch: Full turnkey delivery – engineering, incentives, installation, commissioning.
- Ongoing Optimization: AI-driven performance tracking via Maxbo Pulse™ platform to ensure peak savings.
- Uptime Guarantee: 99.9% system availability SLA backstopped by 10-year warranties.
“We ensure your BESS investment delivers maximum value – and peace of mind. Let’s raise a glass to lower bills and flawless fermentation.”