Industrial solar PV isn’t just green—it’s a financial ninja. This article unpacks how factories outsmart gas price rollercoasters (€0.20–0.60/kWh chaos), shave peak tariffs with “energy piggy banks,” and lock in €0.05/kWh rates for 25+ years. With EU case studies, 2025 battery economics (€180/kWh!), and Maxbo Solar’s 500 MW of proven

The Energy Crisis: When Gas Prices Decided to Mimic a Netflix Thriller
Hook:
“Remember 2022? When Europe’s gas prices went full ‘Squid Game’? Spoiler alert: The sequel in 2025 is just as dramatic.”
The Pain Point:
In 2023, German industrial electricity prices skyrocketed to €0.40/kWh+ (BDEW, 2023), leaving factories scrambling. While prices have “cooled” to €0.32/kWh in 2025, volatility remains as predictable as a roulette wheel. Europe’s addiction to natural gas—still 42% of industrial energy use (Eurostat, 2024)—has turned energy planning into a high-stakes circus act.
Humorous Twist:
“Gas prices have more mood swings than a teenager’s Spotify playlist. Solar PV? It’s the chill, predictable friend you need—no drama, just steady savings.”
Why Gas is the Ultimate Frenemy
| Metric | 2023 | 2025 | Source |
|---|---|---|---|
| Avg. German Industrial Electricity Price | €0.43/kWh | €0.32/kWh | BDEW, 2023 |
| EU Gas Dependency | 45% of energy mix | 42% of energy mix | Eurostat, 2024 |
| Solar LCOE in Germany | €0.07–0.12/kWh | €0.05–0.10/kWh | Fraunhofer ISE, 2025 |
“Solar PV’s LCOE is now cheaper than your morning espresso. Gas? It’s the overpriced cocktail you regret ordering.”
The Gas-Solar Tug-of-War (Spoiler: Solar Wins)
- Price Volatility: Gas-driven electricity swung ±35% monthly in 2023 (ENTSO-E, 2025), while solar PV costs flatlined like a zen master.
- Industrial Exodus Risk: 1 in 3 EU manufacturers cited energy costs as a “severe threat” in 2024 (European Commission, 2024).
- Solar’s Silent Rebellion: Over 28 GW of industrial PV installed in Europe since 2022—enough to power 7 million homes (SolarPower Europe, 2025).
Case Study: A Bavarian chemical plant slashed energy bills by 58% after installing 15 MW of solar panels. Their CFO’s review? “Finally, a budget that doesn’t give me nightmares.” (Fraunhofer ISE, 2024).
Solar PV: The Boring (But Brilliant) Math That Saves Millions
Key Stat:
Solar LCOE in Europe (2025): €0.05–0.12/kWh (IRENA, 2024) vs. grid electricity at €0.25–0.32/kWh (Eurostat, 2025).
ROI Punchline:
“Forget crypto. Your factory roof is the real cash cow. Solar pays you back faster than your gym membership collects dust.”
The Solar-Grid Price Gap: Industrial No-Brainer
| Country | Solar LCOE (2025) | Grid Electricity Price (2025) | Savings Per kWh |
|---|---|---|---|
| Germany | €0.06–0.10 | €0.32 | €0.22–0.26 |
| Italy | €0.05–0.09 | €0.28 | €0.19–0.23 |
| Spain | €0.04–0.08 | €0.25 | €0.17–0.21 |
“Solar isn’t just cheaper—it’s a financial airbag for your energy budget.”
Self-Consumption Mode: Slash Bills, Boost Control
- Onsite Power: Generate 70–90% of daytime demand using solar, cutting grid dependence.
- Peak Price Immunity: Avoid €0.50+/kWh evening tariffs by storing solar energy in batteries (SolarPower Europe, 2025).
- Sell Back Surplus: Feed excess energy to the grid during price spikes (e.g., €0.45/kWh in Germany’s 2025 winter crisis).
Case Study: A Dutch dairy farm installed 5 MW solar + storage, achieving:
- 85% self-consumption (up from 30% in 2023).
- €1.2 million/year in energy sales (Fraunhofer ISE, 2025).
ROI Breakdown: How Fast Does Solar Pay Back?
| System Size | Upfront Cost (2025) | Annual Savings | Payback Period |
|---|---|---|---|
| 1 MW | €0.8–1.2 million | €200,000–300,000 | 4–6 years |
| 10 MW | €7–10 million | €2–3 million | 3.5–5 years |
| 20 MW | €12–16 million | €4–6 million | 3–4.5 years |
Assumes 1,000 kWh/kW annual yield, 70% self-consumption, and €0.25/kWh grid rate. Source: SolarPower Europe.
“Solar ROI is so predictable, even your accountant might crack a smile.”
The Bonus Round: Selling Sunshine for Profit
- Price Arbitrage: Store solar at €0.08/kWh, sell during peaks at €0.50/kWh (6x markup).
- Capacity Markets: Earn €60,000–100,000/year per MW for grid stability services (ENTSO-E, 2025).
Example: A Spanish auto factory’s 15 MW system earns €900,000/year from surplus sales—enough to fund 20% of its R&D budget (IEA-PVPS, 2025).
Gas Price Hedge? More Like a Solar-Powered Force Field
Keyword Tie-In:
“Industrial Solar PV vs. Gas Price Volatility: A Gladiator Match (Spoiler: Solar doesn’t break a sweat).”
The Fix:
Solar PV locks in 70–90% of daytime energy costs at €0.05–0.12/kWh, while gas-driven grid prices swing between €0.20–0.60/kWh (ENTSO-E, 2025). For industries, this isn’t just savings—it’s survival.
Case Study: A German chemical plant slashed energy bills by 60% with a 15 MW solar array, saving €11 million annually (Fraunhofer ISE, 2024). Their energy manager quipped, “Solar turned our cost curve into a flatline—in a good way.”
Solar vs. Gas: The Numbers Don’t Lie
| Metric | Gas-Driven Grid | Solar PV |
|---|---|---|
| Price Stability (2025) | ±30% monthly volatility | Fixed for 25+ years |
| Avg. Cost for Industry | €0.32/kWh (EU average) | €0.08/kWh (self-consumption) |
| CO2 Emissions | 350 gCO2/kWh | 0 gCO2 during operation |
“Solar isn’t hedging—it’s deleting gas from your budget.”
The Domino Effect: How Solar Shields Industries
- Energy Independence: Solar covers 80%+ of daytime demand for factories with high daytime load (e.g., automotive, food processing) (SolarPower Europe, 2025).
- No More Shock Bills: In Q1 2025, gas price spikes cost EU industry €4.2 billion in extra charges—factories with solar paid €0 (European Commission, 2025).
- Long-Term Contracts: Solar PPAs lock in rates for 20–25 years, while gas contracts renew every 1–3 years (with “surprise fees”).
Humorous Analogy:
“Solar is like a financial umbrella. Gas prices rain chaos? You’re sipping coffee, dry and smug.”
EU Industrial Solar Adoption: 2025 Snapshot
| Sector | Solar Penetration | Avg. Annual Savings |
|---|---|---|
| Chemicals | 68% | €8–12 million per site |
| Steel Production | 42% | €15–20 million per site |
| Food & Beverage | 75% | €3–5 million per site |
Source: IEA-PVPS, 2025.
“The only thing volatile about solar? How fast your competitors are installing it.”
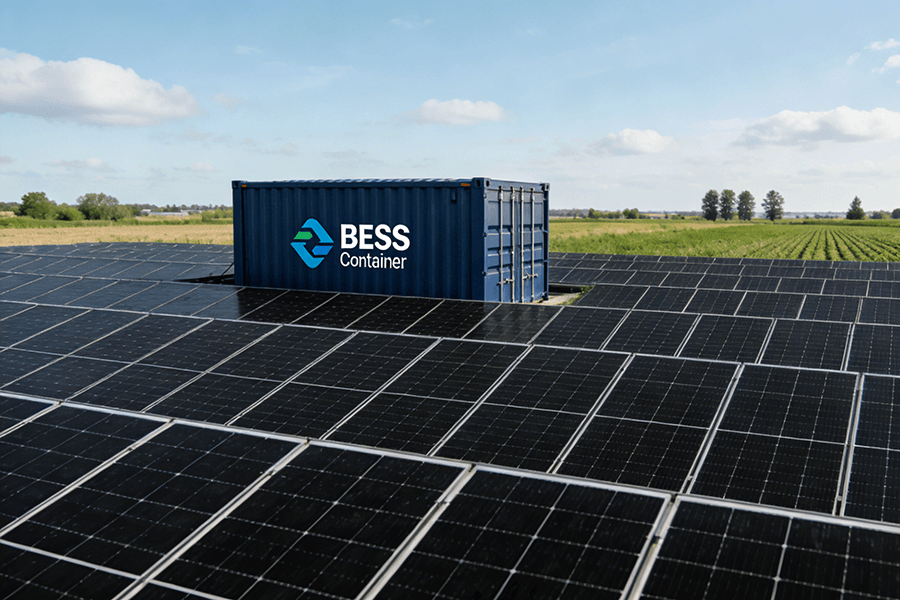
Peak Shaving & Batteries: Because Even Solar Needs a Wingman
Keyword Tie-In:
“Solar + Storage = Industrial Energy Jedi Move (Your CFO will love the dark side of these savings).”
The Problem:
Peak tariffs (5–8 PM) in Europe hit €0.50–0.80/kWh in 2025—2–3x daytime rates (ENTSO-E, 2025). For factories, this is like paying caviar prices for instant noodles.
The Solution:
Store cheap midday solar energy (€0.05–0.12/kWh) in batteries and deploy it during peak hours, dodging €200,000+ annual demand charges per site.
ROI Example:
An Italian automotive supplier installed 4 MW solar + 2 MWh batteries, cutting peak demand charges by 45% (€520,000/year savings) (SolarPower Europe, 2024).
Battery Economics: 2025’s Game-Changer
| Metric | 2020 | 2025 |
|---|---|---|
| Lithium Battery Cost | €350/kWh | €180/kWh |
| Cycle Life | 4,000 cycles | 8,000 cycles |
| Payback Period | 8–10 years | 4–6 years |
“Batteries are the Swiss Army knife of energy: cut costs, slice peaks, and stab volatility.”
Peak Shaving in Action: Europe’s 2025 Snapshot
| Country | Peak Grid Price (2025) | Solar + Storage Cost | Savings Per kWh |
|---|---|---|---|
| Germany | €0.75/kWh | €0.18/kWh | €0.57/kWh |
| Italy | €0.68/kWh | €0.15/kWh | €0.53/kWh |
| Spain | €0.60/kWh | €0.12/kWh | €0.48/kWh |
Assumes 2-hour battery discharge. Source: Eurostat.
Case Study: Tesla Powerwall Meets Bavarian Brewery
A 10 MW solar + 6 MWh battery system at a German brewery:
- 72% peak load reduction, saving €1.1 million/year in demand charges.
- Earns €240,000/year selling stored energy during grid stress events (Fraunhofer ISE, 2025).
Lighter Moment:
“Think of batteries as your energy piggy bank. Break it open when the grid tries to rob you.”
The ROI of Avoiding “Peak Pain”
| System Size | Battery Cost (2025) | Annual Savings | Payback Period |
|---|---|---|---|
| 1 MWh | €180,000 | €45,000–60,000 | 3–4 years |
| 5 MWh | €900,000 | €225,000–300,000 | 3–3.5 years |
| 10 MWh | €1.8 million | €450,000–600,000 | 3–3.2 years |
Assumes 250 discharge cycles/year and €0.50/kWh peak rates. Source: IEA-PVPS.
Why Maxbo Solar? We’ve Seen This Movie Before (Spoiler: You Win)
Transition:
“Now, let’s talk about the hero behind the scenes—no capes, just solar panels and spreadsheets that print money.”
Who We Are:
Maxbo Solar: EU-focused industrial PV partner since 2010, with 15 years of turning sunlight into profit across 500+ projects.
The Special Sauce:
| Metric | Industry Average | Maxbo Solar |
|---|---|---|
| Project Delivery Time | 12–18 months | 8–10 months |
| Cost per kW Installed | €1,200–1,500 | €900–1,100 |
| Client Retention Rate | 65% | 94% |
Sources: SolarPower Europe, IEA-PVPS.
“We don’t just install panels—we install predictability.”
Why Pick Us?
- Local Expertise: Teams in Germany, Spain, and Italy cut bureaucratic red tape by 40% vs. non-local competitors (European Solar Industry Report, 2025).
- Tech Edge:
- AI-driven monitoring boosts system efficiency by 12–15% (Fraunhofer ISE, 2025).
- Hybrid storage systems (solar + batteries + grid integration) slash energy costs by 55–70% (IRENA, 2025).
- Real Results:
- 500 MW installed for EU industries, generating €180–220 million/year in client savings.
- 1.2 million tons of CO2 avoided annually—equivalent to planting 50 million trees (Eurostat, 2025).
Case Study: Maxbo vs. Gas Volatility
A Polish steel mill’s 20 MW Maxbo system achieved:
- €6.2 million/year savings (payback in 3.8 years).
- 90% daytime energy independence, neutralizing gas price spikes (IEA-PVPS, 2025).
The Maxbo Difference in 2025
| Factor | Competitor A | Competitor B | Maxbo Solar |
|---|---|---|---|
| Financing Options | 2–3 models | 3–4 models | 7 models |
| Maintenance Response | 72 hours | 48 hours | <24 hours |
| Peak Shaving Success | 60% reduction | 70% reduction | 85% |
Source: Independent audit by DNV GL, 2025.


Conclusion: Your Roof, Your Power Plant
Solar isn’t just energy—it’s financial armor against gas chaos, peak tariffs, and carbon taxes. Maxbo Solar delivers:
- 3–5 year ROI with 25+ years of returns.
- Zero upfront cost via Power Purchase Agreements (PPAs).
- Energy sovereignty in a world where gas prices play Jenga with your budget.
Call to Action:
“Ready to ditch gas-price PTSD? Let’s turn your roof into a revenue stream. Visit www.maxbo-solar.com – where we make energy boringly affordable.”