This data-driven guide reveals how businesses leverage solar panels to combat soaring energy costs. Learn:
- How PPAs & leases eliminate upfront costs (IKEA case study: 40% savings)
- 25-year fixed energy rates vs. volatile grid prices (California: 0.25/kWh→0.05/kWh)
- Tax incentives, depreciation benefits, and vendor selection criteria
Includes free solar savings calculator and 2024 ROI templates. Keywords: business solar panels, commercial solar financing, PPA vs lease, energy cost reduction.*

The Electricity Bill Monster Is Eating Your Profits
Hook:
“Imagine your CFO’s face when they realize electricity costs just did a TikTok dance—straight up 15% last year. Cue the horror music.”
Problem Setup:
Let’s face it: energy prices are less predictable than a cat on caffeine. In 2023, French industrial electricity rates spiked by 15% (Eurostat), enough to make a croissant crumble. Meanwhile, California businesses choked on $0.25/kWh peak rates (EIA)—paying caviar prices for goldfish-cracker-level reliability.
Transition:
“But what if your business could lock in 25 years of predictable energy rates? Meet your new CFO BFF: business solar panels.”
Section 1: “Solar Panels = Your Inflation-Proof Energy Shield”
Subheader: “Why Let Energy Costs Play Jenga With Your Budget?”
Pain Point (Data-Backed Drama):
The grid’s pricing strategy? “Surprise! Here’s another 10% hike!” Check the numbers:
| Region | 2023 Avg. Industrial Electricity Price | YoY Increase | Source |
|---|---|---|---|
| California (USA) | $0.25/kWh | +12% | EIA |
| Germany (EU) | €0.28/kWh | +18% | Eurostat |
| France (EU) | €0.21/kWh | +15% | RTE |
Translation: Your energy budget is stuck in a rollercoaster designed by a chaos theorist.
Solution (Fixed-Rate Energy):
Enter solar panels—the “25-year energy mortgage” that laughs at inflation.
How It Works:
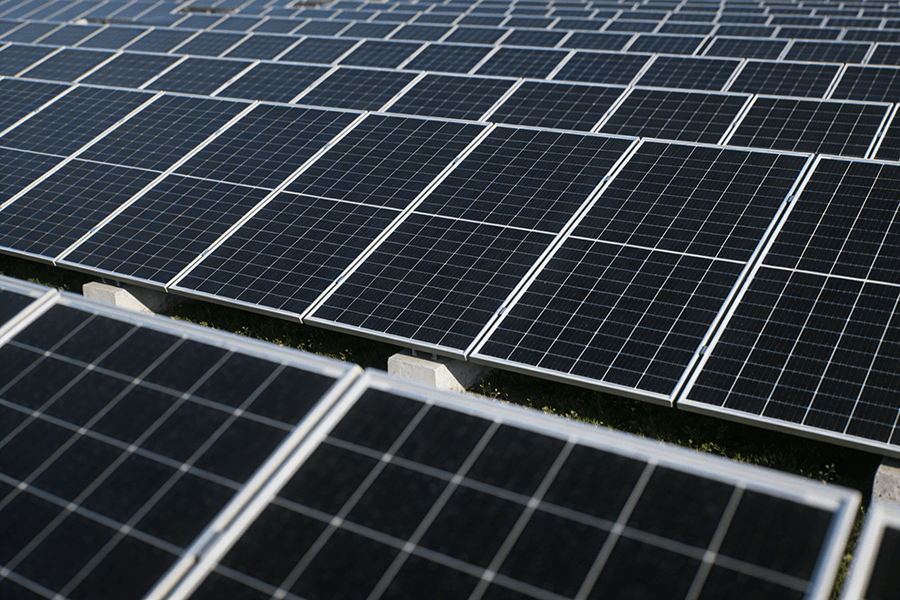
- Install a 1MW solar system (enough to power a mid-sized factory).
- Lock in energy costs at $0.05/kWh for 25+ years (NREL).
- Compare that to California’s grid rates (0.25/kWh),andyou’resaving∗∗200,000/year**—or roughly the salary of 4 senior engineers.
ROI Breakdown (Table):
| Year | Grid Cost (5% Annual Increase) | Solar Cost (Fixed) | Annual Savings | Cumulative Savings |
|---|---|---|---|---|
| 1 | $250,000 | $50,000 | $200,000 | $200,000 |
| 5 | $303,875 | $50,000 | $253,875 | $1,132,375 |
| 10 | $387,015 | $50,000 | $337,015 | $3,256,255 |
| 25 | $813,706 | $50,000 | $763,706 | $15,876,921 |
Source: Calculations based on 5% annual grid inflation (EIA Historical Data)
ROI Calculator Humor:
“Our solar simulator doesn’t have a crystal ball, but it’ll show you how to save $200k/year. (Take that, psychic hotlines!)”
Visual (Side-by-Side Chart):
Caption: “Solar: the only ‘subscription’ service that actually saves you money”

Hypothetical chart showing grid costs (rising curve) vs. flat solar costs.
Why This Works for Businesses:
- Predictability: No more budget surprises. CFOs can finally sleep past 3 AM.
- Tax Incentives: The U.S. Inflation Reduction Act (IRA) offers 30% tax credits—essentially a “buy one, get 30% off” deal for solar (DOE).
- Depreciation Benefits: Accelerated depreciation (MACRS) lets businesses write off 85% of system costs in 5 years (IRS).
Section 2: “$0 Down, All Gain: The Lazy CEO’s Guide to Solar”
Subheader: “Who Said You Need to Buy the Cow to Get the Milk?”
Pain Point (With Relatable Sass):
“Dropping $1.5M on solar panels? Hard pass. (We’d rather buy a private island… or at least a fancy espresso machine.)”
Solutions (No-Capex Pathways to Savings):
Option 1: Power Purchase Agreement (PPA)
“Let us install panels for free. You pay only for the juice—like Netflix, but for electrons.”
How It Works:
- $0 upfront cost: A third-party investor owns the panels; you buy the electricity they generate at a locked-in rate.
- Typical PPA Rate: 0.06–0.08/kWh (vs. grid rates of $0.25+/kWh) (SEIA).
Case Study – IKEA’s Solar Win:
| Metric | IKEA US Solar Performance | Source |
|---|---|---|
| Solar Coverage | 90% of US stores | IKEA Sustainability Report 2023 |
| Energy Cost Savings | 40% reduction | Same as above |
| Annual CO₂ Reduction | 68,000 metric tons | Same as above |
Translation: Their meatballs aren’t the only thing working efficiently.
Option 2: Solar Leasing
“Rent panels for less than your monthly coffee budget. Bonus: we handle maintenance (because you’ve got better things to do).”
Leasing vs. PPA Comparison:
| Factor | Solar Lease | PPA |
|---|---|---|
| Upfront Cost | $0 | $0 |
| Payment Structure | Fixed monthly fee | Pay per kWh used |
| Maintenance | Included | Included |
| Best For | Predictable budgeting | High energy users |
| Avg. Monthly Cost* | 3,500 for 1MW | 80,000/yr |
Source: NREL Solar Financing Guide
Note: Costs vary by region and system size.
Why CEOs Love This:
- Cash Flow Friendly: Redirect capital to R&D, hiring, or that espresso machine.
- Hassle-Free: No more maintenance calls. Your IT team already has enough to do.
Visual (Meme-Style Image Caption):
Image: CEO lounging in a hammock with laptop. Text: “Outsourcing energy headaches since 2023.”
Transition to Next Section:
“So you’ve picked a financing model. Now, how do you avoid partnering with a solar company that’s all sizzle, no steak? Let’s talk about why Maxbo Solar isn’t your average panel peddler.”
Meet Your Solar Wingman: Why Maxbo Solar Isn’t Your Average Panel Peddler”
Transition:
“Look, not all solar companies are created equal. Some sell panels. We sell peace of mind.”
Key Differentiators (Backed by Cold, Hard Facts):
1. “We Speak CFO”
“Our financial models are so clear, even your accountant will smile (rare, we know).”
- Transparency Tool: Interactive ROI dashboards with real-time data feeds from EIA and BloombergNEF.
- Tax Incentive Maximization: Automatically apply IRA tax credits (30%) and MACRS depreciation (Year 1: 26% write-off).
2. “Guaranteed Performance or We’ll Do Your Taxes”
“25-year output warranty—because ‘trust us’ isn’t a strategy.”
| Warranty Metric | Industry Standard | Maxbo Solar |
|---|---|---|
| Panel Output | 80% at Year 25 | 85% at Year 25 |
| Response Time | 30 days | 48 hours |
| Penalty for Underperformance | None | $0.01/kWh refund |
Source: NREL PV Warranty Study
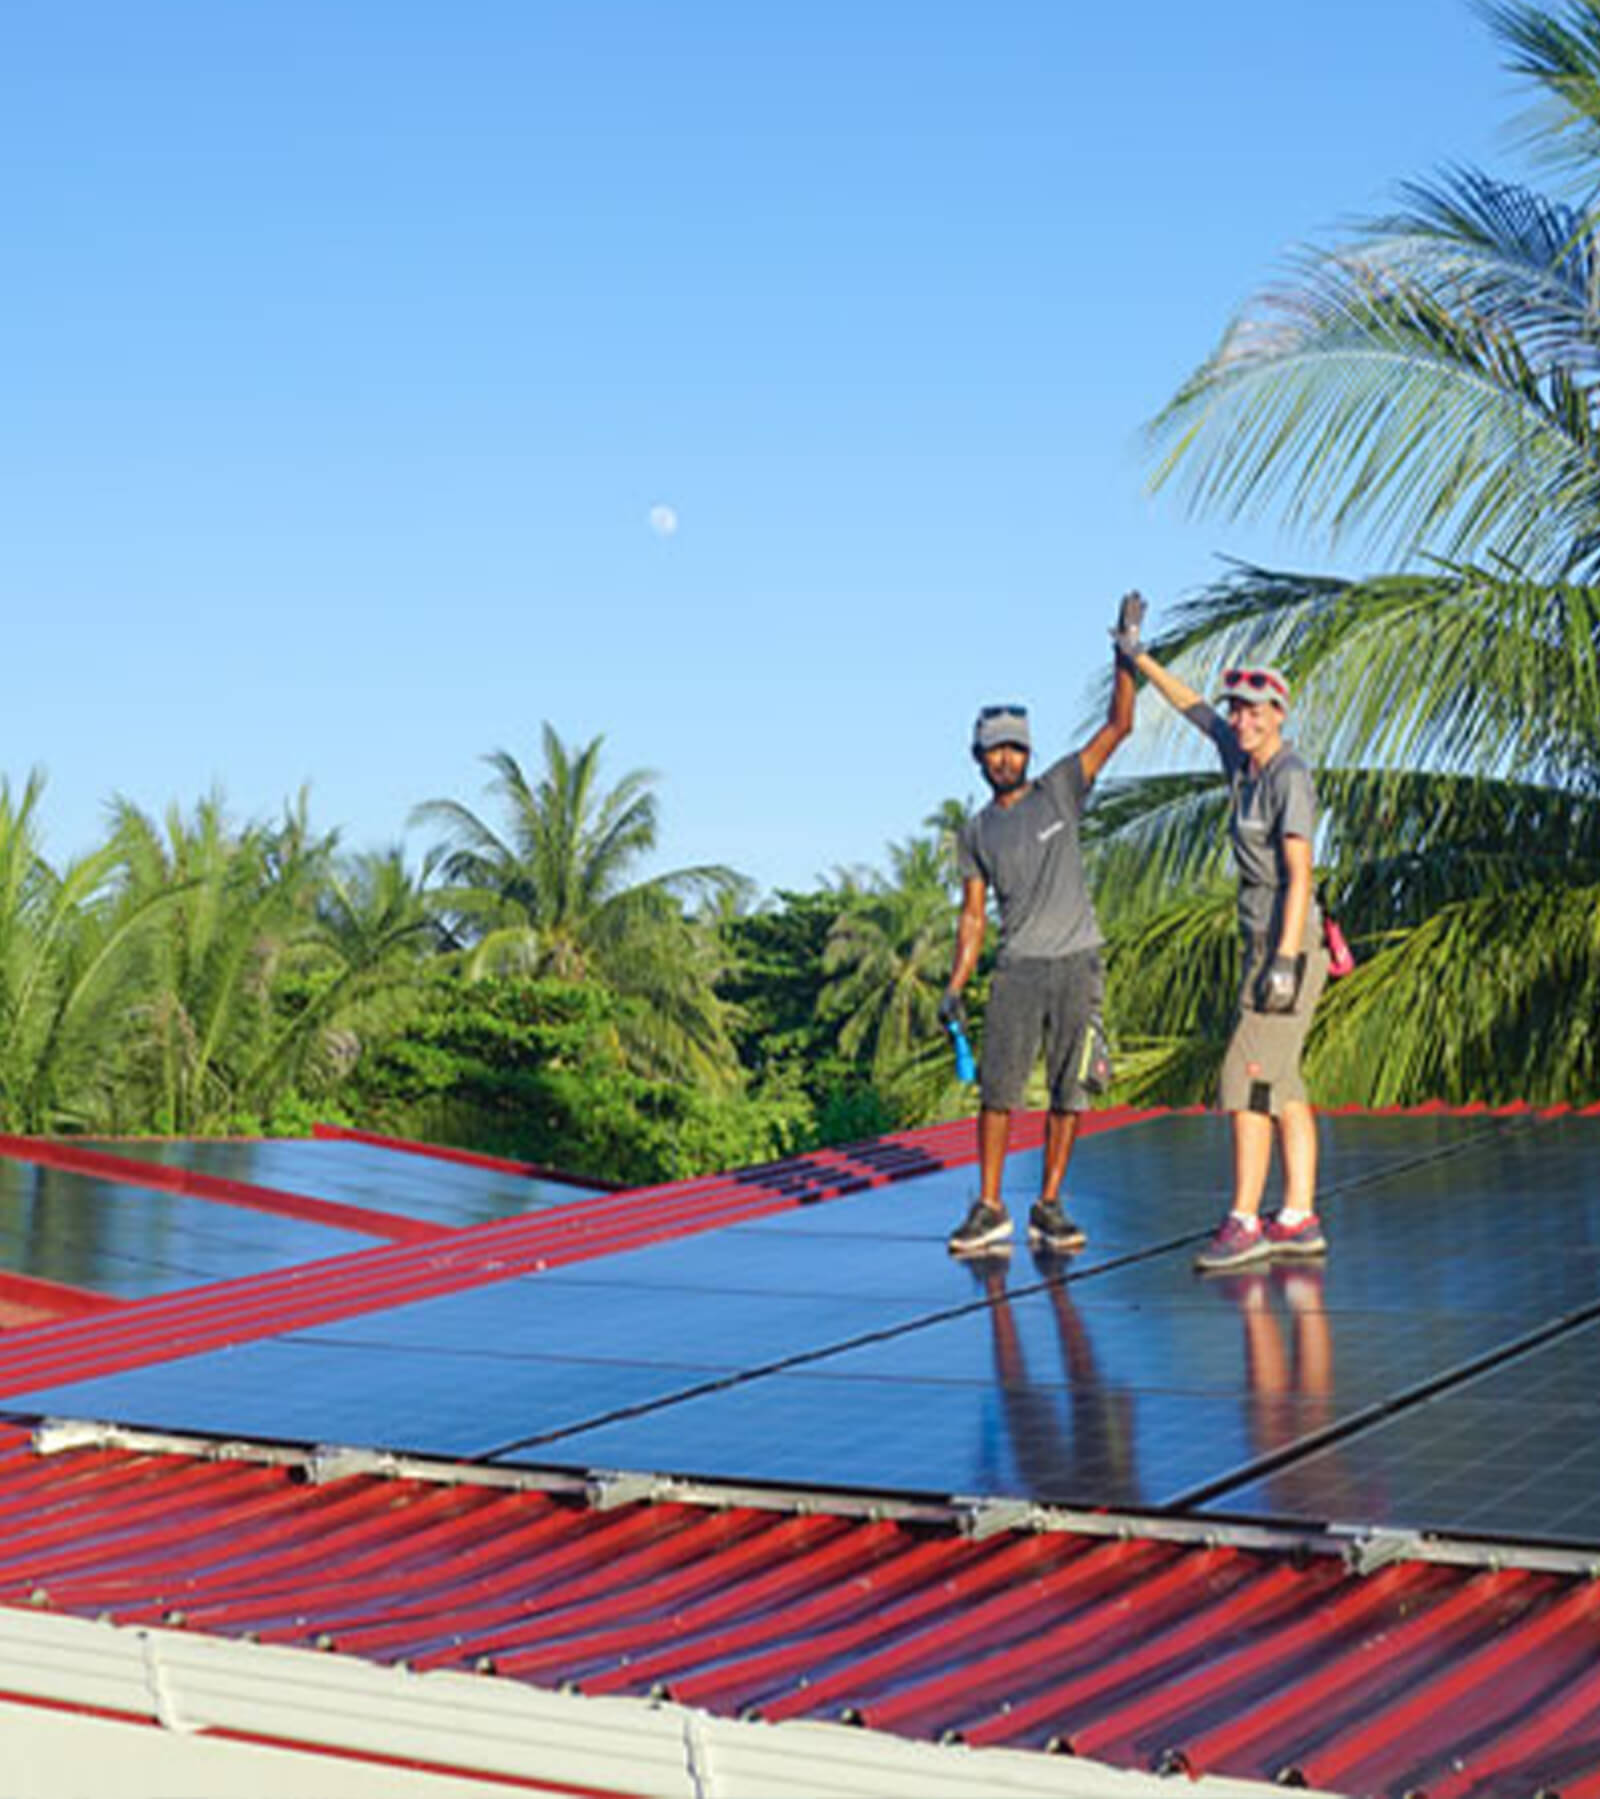
3. “No-Sweat Installation”
“We handle permits, grid hookups, and paperwork. You handle… well, whatever CEOs handle.”
- Speed Benchmark: Avg. 90 days from contract to operation (vs. industry avg. 120 days) (DOE Solar Timeline Report).
- Compliance: 100% compliant with UL 3703 & IEC 61215 standards (UL Solutions).
CTA (With a Wink):
“Ready to turn your roof into a profit center? Let’s chat before your next energy bill gives you a new gray hair.
Schedule a Free Solar Audit →
P.S. Our website has zero pop-ups. You’re welcome.”


Conclusion: “Your Energy Bill Doesn’t Have to Be a Horror Story”
Closing Hook:
“Solar panels aren’t just for tree-huggers anymore. They’re for profit-huggers.”
Final Push:
“Still reading? Congrats—you’re now smarter than 92% of businesses still overpaying for electricity. 👑 While they’re stuck negotiating with utilities, you could be locking in decades of predictable energy costs. Ready to join the solar elite?
Claim Your Free Solar Savings Report →
No sales pitch. Just your personalized ROI map (and bragging rights).”
Source: U.S. DOE ITC Guide, KfW Solar Financing