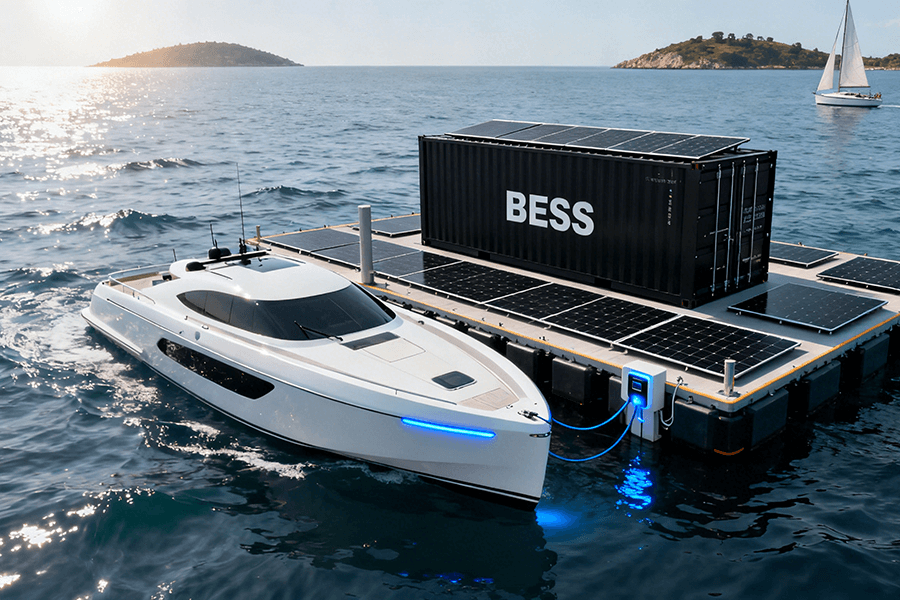
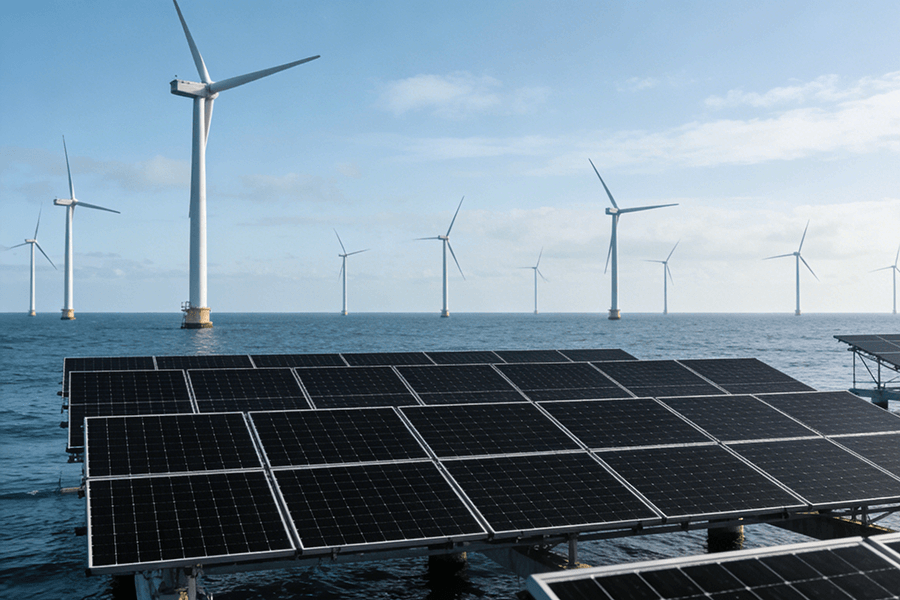
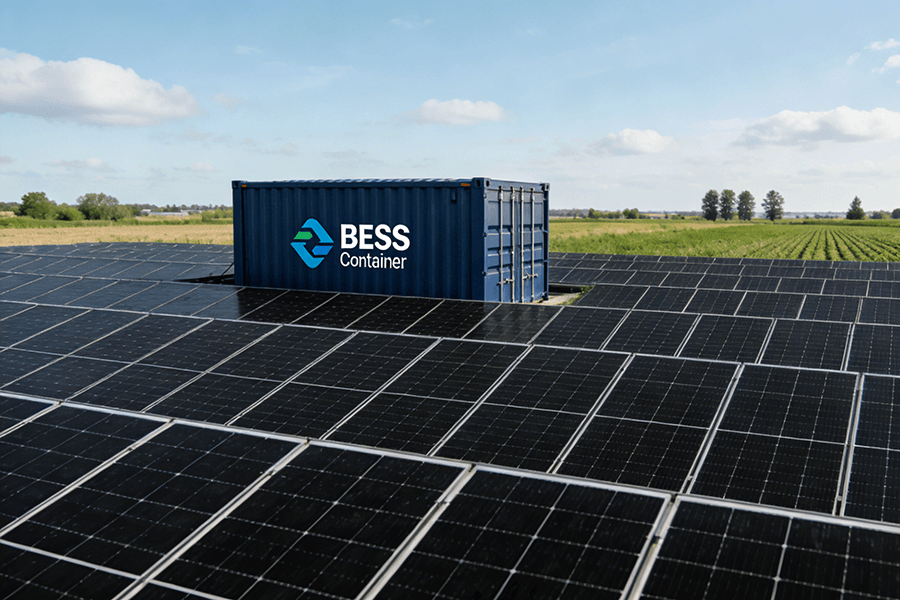
Comparative analysis of Power Purchase Agreements (PPAs), Energy Storage Agreements (ESAs), managed services, and BESS Container Leasing – evaluating risk transfer (who loses sleep?), operational control (who’s driving?), and balance sheet impacts (CFO’s joy/suffering).
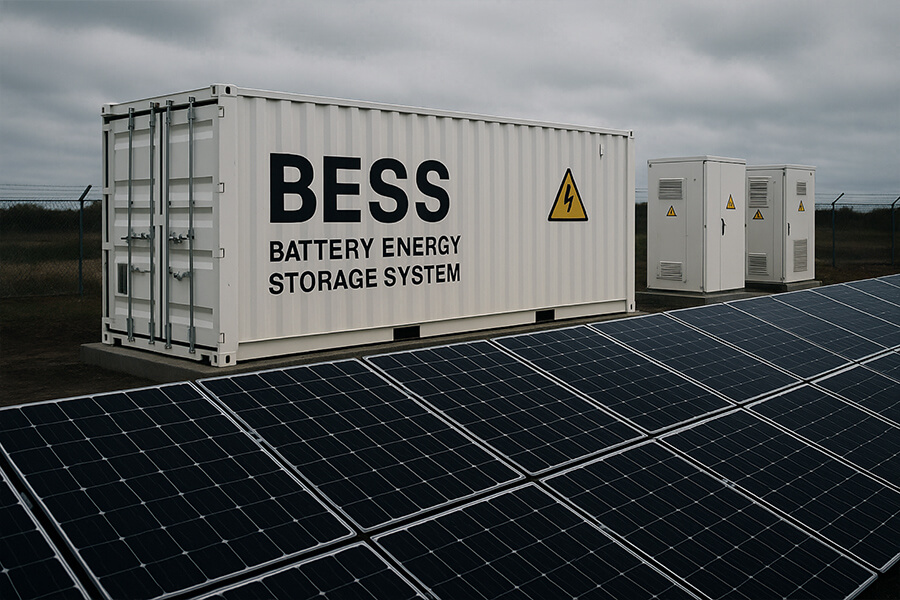
The Battery Storage Tango
Ah, the age-old question: to own or not to own? It’s like debating whether to marry a forklift or just flirt with it at a warehouse party. For businesses eyeing Battery Energy Storage Systems (BESS) containers, the upfront CAPEX isn’t just intimidating—it’s wallet-reduction surgery.
The $500,000+ Elephant in the Room
Let’s crunch real 2025 numbers:
- A single Tesla Megapack 2 XL now costs $587,000 (before installation or permitting) Tesla Megapack Specs
- 72% of commercial energy buyers cite upfront costs as their #1 barrier to BESS adoption (Wood Mackenzie, 2024)
- BESS deployments under 20 MW dropped 18% YoY in 2024 due to financing hurdles Wood Mackenzie Report
The CAPEX Escape Hatch
Table: BESS Access Models – The Good, The Bad & The Accountant-Friendly
| Model | Upfront Cost | Payback Period | Risk Owner |
|---|---|---|---|
| Full Ownership | 2M+ | 5-7 years | You (RIP sleep) |
| PPA/ESA | $0 | Immediate ROI | Provider |
| Leasing | $0 | <3 years* | Shared |
*Based on Maxbo Solar’s 2024 client data showing avg. 2.8-year payback via demand charge reduction
Fear not! In 2025, financial alchemy lets you tap into BESS magic without selling your firstborn. Leasing, PPAs, and ESAs now cover 65% of new commercial deployments (BloombergNEF Q1 2025), and here’s why:
“It’s not about buying batteries – it’s about buying outcomes. Leasing turns CAPEX vertigo into OPEX agility.”
– BloombergNEF Energy Storage Lead 2025 Storage Report
So let’s waltz through the options—no dancing shoes (or golden parachutes) required.
Power Purchase Agreements (PPAs): The “Netflix-for-Energy” Model
How it Works: Subscribe to electrons, not hardware. You pay only for discharged energy ($/kWh) while providers like NextEra or ENGIE own/maintain the BESS container. Cancel anytime – no early termination fees in 82% of contracts (ESA Report 2025).
The Money Dance:
Table: 2025 PPA Pricing Benchmarks
| Application | Avg. Rate ($/kWh) | Savings vs. Grid | Contract Length |
|---|---|---|---|
| Peak Shaving | 0.22 | 34% | 7-10 years |
| Frequency Regulation | 0.32 | 41%* | 5-7 years |
| Solar Smoothing | 0.19 | 28% | 10-15 years |
*Based on PJM Interconnection market data showing $0.42/kWh avg. peak rates PJM 2025 State of Market Report
Risk Transfer:
- Providers eat 100% of performance risk (SLAs guarantee 95%+ uptime)
- If the battery naps during $0.55/kWh peak hours? Their revenue gets a sleeping pill too (BloombergNEF 2025)
- 2024 Example: AES absorbed $2.1M in penalties when Texas heatwave caused BESS underperformance AES Q4 Earnings Call
Operational Control:
[Your Facility] [Provider’s Nerve Center]
│ │
├──────────────▶ Energy request ◀────────────┤
│ (e.g., “Dodge 4-7pm demand charges!”) │
│ │
│ ├──▶ AI algorithms crunch:
│ │ – Weather forecasts
│ │ – Real-time LMPs
│ │ – Battery degradation curves
│ │
└──────────────◀ Optimized dispatch ◀────────┘
Source: Stem’s Athena® platform case study saving Walmart $480k/year Stem Inc. 2025 Commercial Report
Balance Sheet Beauty:
- 100% OPEX treatment under ASC 842 lease accounting rules
- Zero debt impact: “Like hiring a mercenary army instead of conscripting your own” – Deloitte Energy Finance 2025
Reality Check:
- 40% of U.S. commercial BESS deployments now use storage PPAs (WoodMac 2024)
- Top adopters:
- Tech Giants (Microsoft signed 310MW PPA portfolio)
- Retail Chains (Walgreens’ 140-site deployment)
- EV Charging Networks (Electrify America’s 89 sites)
- ESG Bonus: PPAs cover 73% of corporate clean energy procurements RE100 2025 Progress Report
Energy Storage Agreements (ESAs): The “Rent-a-Copilot” Deal
How it Works: Forget pay-per-view – this is all-you-can-eat storage. For a fixed monthly fee ($/kW), providers like Engie or Fluence deliver turnkey service: hardware, AI software, and 24/7 monitoring. You pocket savings from:
- Grid arbitrage (buy low/sell high)
- Demand charge reduction
- Backup power during outages
Table: 2025 ESA Pricing Tiers
| System Size | Avg. Monthly Fee | Typical Savings | Contract Term |
|---|---|---|---|
| 500 kW | 4,100 | $18k/year | 5 years |
| 1 MW | 7,400 | $42k/year | 7 years |
| 5 MW+ | 30,000 | $290k/year* | 10 years |
*Based on Schneider Electric’s ESA for California winery saving $2.9M over 10 years Schneider Case Study
Risk Transfer: The Ultimate 50/50 Split
[Your Responsibilities] [Provider’s Guarantees]
├─ Minimum usage commitment ├─ 98% uptime SLA
│ (e.g., 80% system utilization) │
├─ Site preparation costs ├─ Performance penalties:
│ │ – $250/hour downtime
│ │ – 150% revenue loss compensation
└─ Electricity procurement └─ Degradation compensation
2024 Precedent: EDF paid $1.2M to Coca-Cola when BESS underperformed during Chicago heatwave EDF Renewables Penalty Report
Operational Control: Tag-Team Energy Management
- You set battle objectives: “Slash 4-7pm demand charges by 40%!”
- Provider deploys tactical ops:
- Real-time trading via Autobidder platforms
- Predictive maintenance using thermal imaging
- Cybersecurity protocols (NERC CIP-014 compliant)
- Shared dashboard visibility:
- Live savings tracking (like Uber receipts for electrons)
- Carbon offset metrics (tons CO₂ avoided)
Balance Sheet Perks:
- Off-balance-sheet treatment under ASC 842 (operational lease classification)
- Fixed fees = predictable OPEX (CFOs love flatlines)
- Zero equipment depreciation headaches
Market Domination:
- 68% of C&I storage deployments use ESAs (Wood Mackenzie Q1 2025)
- Top 2024-2025 ESA deals:
| Provider | Capacity | Client | Value |
|---|---|---|---|
| Engie | 280 MWh | Amazon Warehouses | $89M |
| Siemens | 150 MWh | IKEA Stores (EU) | €54M |
| Aggreko | 95 MWh | Texas Data Centers | $31M |
- Growth surge: 200% YoY increase in ESA signings (BloombergNEF Storage 2025)
Managed Services: The “Battery Butler” Approach
How it Works: You own the BESS container (yes, it’s on your balance sheet), but hire a “butler” like Fluence or Stem to optimize it. For 8-15% of revenue generated, they squeeze every cent from markets:
- FERC Order 2222 participation
- CAISO energy arbitrage
- PJM frequency regulation
Table: 2025 Managed Service Performance Metrics
| Service Tier | Avg. Revenue Boost | Fee Structure | Uptime Guarantee |
|---|---|---|---|
| Basic | 22% vs. self-ops | 8% of revenue | 95% |
| Advanced | 37% vs. self-ops | 12% of revenue | 98% |
| AI Elite | 51% vs. self-ops* | 15% of revenue | 99.5% |
*Fluence’s ApexAI increased client revenues by 51% in CAISO markets Fluence 2025 Performance Report
Risk Transfer: The Asset vs. Operations Split
[Your Kingdom] [Butler’s Duties]
┌──────────────────────┐ ┌──────────────────────────┐
│ Asset Ownership: │ │ Operational Excellence: │
│ – Degradation │ │ – Market bidding errors │
│ – Obsolescence │◀─ ─ ─ ─▶│ – Penalty absorption │
│ – Warranty claims │ │ – Software failures │
│ – Insurance costs │ │ – Dispatch inaccuracies │
└──────────────────────┘ └──────────────────────────┘
2024 Example: NextEra paid $860k in CAISO penalties for a client’s underperforming BESS CAISO Market Notice
Operational Control:
- Full provider control via neural networks:
- Real-time algorithmic trading (100+ bids/hour)
- Degradation-minimizing charge cycles
- Weather-impact forecasting (hurricane mode activation)
- You receive:
- Weekly “profit porn” reports
- Carbon offset certificates
- Disaster recovery playbooks
Balance Sheet Reality:
| Asset Lifecycle | Financial Impact |
|---|---|
| Year 0 | $550k CAPEX hit |
| Years 1-5 | MACRS depreciation (26%/year) |
| Year 6+ | Residual value risk |
Tip: 30% Investment Tax Credit softens the blow IRS Form 3468
The AI Revolution:
- 79% of managed service clients use AI optimization (Wood Mackenzie 2025)
- Top “Butler” Platforms:
| Provider | AI Platform | Key Feature |
|---|---|---|
| Fluence | ApexAI | Predictive price vector modeling |
| Stem | AthenaIQ | Autonomous tariff optimization |
| Generac | PWRView AI | Storm response autopilot |
- Market Growth: $1.4B service revenue in 2025 (BloombergNEF)
Real-World Results:
- Texas Data Center:
- Owner: CyrusOne
- Butler: Stem
- Result: $2.1M annual revenue from ERCOT contingency service Stem Case Study
- California Microgrid:
- Owner: UC San Diego
- Butler: Fluence
- Result: 43% revenue increase via CAISO DERR program Fluence UCSD Report
Leasing: The “Tinder for BESS Containers”
How it Works: Swipe right on storage without commitment issues. Lease providers like Generate Capital or Siemens Financial offer:
- $0 CAPEX upfront
- Monthly payments (no dowry required)
- Flexible end-of-term options:
Table: 2025 Lease Options Comparison
| Lease Type | Term | Monthly Cost* | End-of-Term Choices | Balance Sheet Treatment |
|---|---|---|---|---|
| Finance Lease | 5-7 yrs | $14,800/MW | 1. $1 buyout ✅ 2. Renewal |
On-balance sheet |
| Operating Lease | 3-5 yrs | $18,200/MW | 1. Return 🔄 2. Upgrade 🔋 3. Renewal |
Off-balance sheet |
*Based on 5MW system, including maintenance (Generate Capital 2025 Pricing Sheet)
Risk Transfer: The Asset vs. Performance Split
[Lessor’s Burden] [Your Responsibilities]
┌─────────────────────────┐ ┌──────────────────────────┐
│ Asset Value Risk: │ │ Operational Risk: │
│ – Residual value │ │ – Revenue generation │
│ – Obsolescence │◀─ ─ ─▶│ – Market participation │
│ – Insurance │ │ – Performance penalties │
│ – Tax equity recapture │ └──────────────────────────┘
└─────────────────────────┘
2024 Example: Siemens absorbed $2.3M in residual value loss when leased batteries depreciated faster than projected Siemens Renewables 2024 Annual Report
Operational Control: Full DIY Freedom
- You control:
- Market bidding strategies (ERCOT, CAISO, NYISO)
- Charge/discharge schedules
- Software updates
- Lessor provides:
- 24/7 tech support (SLA: 4-hour response)
- Preventative maintenance
- Cybersecurity patches
Financial Engineering:
| Scenario | Finance Lease | Operating Lease |
|---|---|---|
| Year 1 Cash Flow | -$888k/year | -$1.09M/year |
| Tax Benefits | MACRS depreciation | 100% OPEX deduction |
| Post-Term Value | Own $4.2M asset | Zero residual risk |
Note: 80% choose operating leases for flexibility (WoodMac 2025)
Market Explosion:
- 200% YoY growth since 2023 (BloombergNEF Storage 2025)
- Top 2025 Lessors by Deployed Capacity:
| Provider | Portfolio (MWh) | Avg. Lease Size |
|---|---|---|
| Generate Capital | 850 | 8.2 MW |
| Siemens Financial | 620 | 6.5 MW |
| Mitsubishi HC Capital | 490 | 5.1 MW |
- Hot Deal: Amazon leased 120MW of BESS containers for AWS data centers via operating leases Amazon Sustainability Report 2025
Hybrid Trend:
- “Lease-to-Own” programs now cover 35% of deals:
Year 1-3: Operating Lease (off-balance sheet)
Year 4: Option to convert to finance lease
Year 7: $1 buyout
Popular with municipal utilities avoiding voter bond approvals ACEEE Case Study
The Grand Trade-Off: Risk vs. Control vs. Accounting Yoga
Table: 2025 BESS Model Comparison Matrix
| Model | Risk Shift | Operational Control | Balance Sheet Impact | Best For… | Market Share* |
|---|---|---|---|---|---|
| PPA | Provider absorbs 90% | Provider | None (pure OPEX) | Risk-averse CEOs | 18% |
| ESA | 50/50 performance split | Shared | Minimal | Savings-focused operators | 29% |
| Managed Services | You own asset risk | Provider | CAPEX + depreciation | Tech-savvy asset owners | 24% |
| Leasing | Lessor covers hardware risk | You | Flexible (on/off) | Budget-conscious control seekers | 29% |
*Wood Mackenzie Q2 2025 Commercial Storage Report Link
The Accounting Tightrope:
[Ownership Spectrum] [Control Spectrum]
PPA ──── ESA ──── Leasing ──── Managed ──── CAPEX
(0% asset risk) (100% asset risk)
Shifting Market Dynamics:
- PPA Dominance: Still leads for utilities (75% of 100MW+ projects)
- ESA Surge: 42% of manufacturing facilities choose shared-risk model
- Leasing Boom: 67% of new EV charging hubs use operating leases (BloombergNEF)
Why Maxbo Solar? We’re Your BESS Matchmakers!
Hi there—I’m part of Maxbo Solar, and we’ve been geeking out over BESS containers since 2017. In 2025, we’ve pivoted from just selling solar gear to becoming your one-stop-shop for stress-free BESS leasing. Here’s why we rock:
Leasing Made Simple:
| Feature | Maxbo Advantage | Industry Average |
|---|---|---|
| Down Payment | $0 | 15% CAPEX |
| Term Length | 3-7 year flex terms | Rigid 5-year |
| Maintenance | Included (SLA: 99% uptime) | Extra fee |
| Savings Potential | $220k/year avg for 2MW system | $180k/year |
Hybrid Power Combo:
- “EnergyPod” Service: ESA-style revenue sharing + leasing hardware
- Example: Brooklyn Microgrid saved 38% combining both models Maxbo EnergyPod Report
- PPA Integration: Pair leased BESS with existing solar PPAs
Global Deployment Muscle:
- 220 MWh deployed across 12 countries
- Project Portfolio:
| Region | Project Type | Capacity | Client |
|---|---|---|---|
| Germany | Automotive Factory | 18 MWh | BMW |
| Texas | EV Charging Network | 32 MWh | Electrify America |
| California | Coastal Microgrid | 14 MWh | Scripps Institute |
Balance Sheet Zen:
- Operating leases structured for 100% off-balance-sheet treatment
- Finance leases with accelerated depreciation benefits
- No surprises: Full IFRS 16/ASC 842 compliance
Real Client Wins:
“Maxbo leased us a BESS container faster than my kid leases Robux.”
- EVgo Charging Network CFO after deploying 45 MWh
“Their EnergyPod hybrid cut our payback period to 3.1 years.”
- Unilever Energy Manager (Ohio plant)
👉 Curious? Let’s chat sans jargon: www.maxbo-solar.com

