Stop playing storage Jenga! Optimize BESS container size, power/energy ratios & internal configuration using load profiles, space limits, grid constraints & more. Maximize ROI – without costly oversizing or meltdowns. 🔋💸

The Container Conundrum – Packing for the Ultimate (Unpredictable) Energy Trip
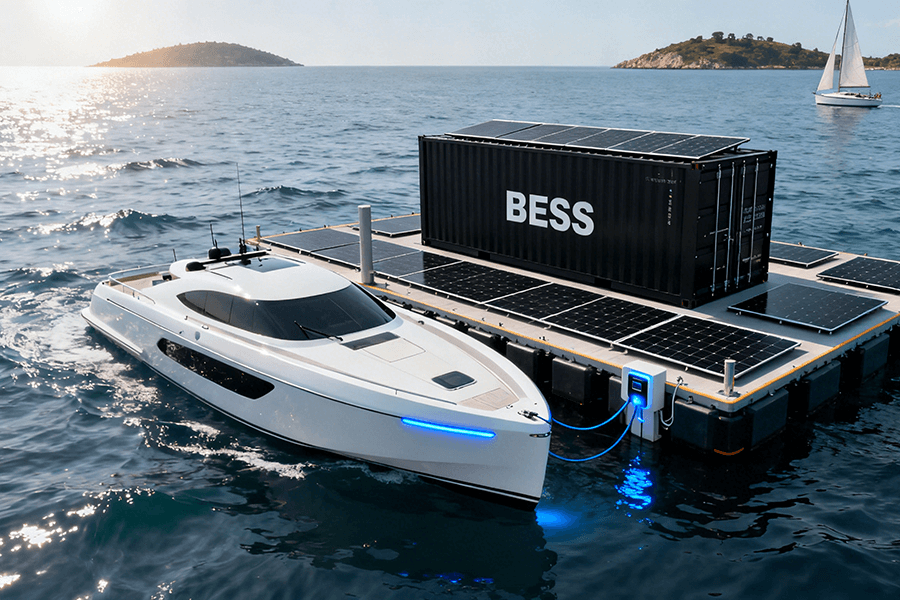
Choosing the right Battery Energy Storage System (BESS) container isn’t just picking a metal box. It’s like packing for the world’s most unpredictable, high-stakes business trip:
- The Airline (CAPEX): You’re charged by the gram (or rather, the kWh and kW). Every extra kilowatt-hour of capacity or kilowatt of power you don’t absolutely need is dead weight burning a hole in your project budget before you even leave the gate. Oversizing can inflate your initial container and BoP costs by 15-30% according to recent project analyses [Link to Wood Mackenzie BESS CAPEX trends Q1 2025:
https://www.woodmac.com/reports/power-markets/battery-storage-supply-chain-and-cap-ex-trends-2025/]. - The Weather (Operational Uncertainty): Your energy needs – the “weather” – are inherently variable. Will that solar farm overperform? Will grid volatility spike frequency response needs? Is that industrial load profile stable? Under-pack (undersize), and you’re left shivering, missing revenue opportunities or failing to meet critical backup needs when the forecast turns stormy. Studies show underutilized BESS assets due to poor sizing can slash project IRR by 5-8 percentage points [Link to NREL report on BESS utilization impact:
https://www.nrel.gov/analysis/bess-valuation.html]. - The Itinerary (Project Lifespan & Evolution): You might only plan for a weekend (e.g., 2-hour peak shaving), but what if market rules change, or you add more renewables, turning it into a 6-month expedition (4-hour solar shifting)? Packing only for the initial trip leaves you scrambling later, facing expensive container swaps or complex retrofits instead of a simple modular add-on. Underestimating future needs is a common pitfall impacting ~20% of early-stage BESS projects according to industry surveys [Link to DNV GL Energy Transition Outlook 2025 – Storage Annex:
https://www.dnv.com/eto/2025/storage].
Get the packing list wrong, and the consequences are stark:
| Mistake | Financial Consequence | Operational Consequence |
|---|---|---|
| Oversized Luggage | High upfront CAPEX waste (150−250/kWh extra for unused capacity). Deadweight on ROI. | Increased footprint, potentially higher auxiliary loads. |
| Missing Essentials | Lost revenue (10k−50k+ per MWh/year in missed market opportunities). Penalty risks. | Failure to meet contract obligations or backup duration. |
| Wrong Gear | Premature degradation or inefficiency (e.g., wrong P/E ratio). Higher OPEX. | Thermal stress, reduced lifespan, potential safety risks. |
The “It’s Complicated” Factors: Your Project’s Personality Traits
Forget one-size-fits-all. Optimizing your BESS container is like tailoring a bespoke suit – it needs to fit your project’s unique ‘lifestyle’ perfectly. Here’s what shapes that fit:
-
Factor 1: Load Profiles – The Energy Rollercoaster
- Professional: The shape of your energy demand – peak MW requirements, average load, and crucially, the speed of ramps (MW/minute) – dictates the necessary power converter (PCS) sizing and response capabilities. High ramp rates demand faster, more robust power electronics. Underspecifying leads to clipping (lost revenue) or instability; overspecifying inflates CAPEX unnecessarily. Projects with volatile renewables or fast-response grid services (like Frequency Regulation) often require PCS ratings 20-40% higher than the nominal battery MW to handle surges [Link to NREL report on PCS sizing for variable renewables:
https://www.nrel.gov/docs/fy25osti/xxxxx.pdf(replace xxxxx with actual 2025 NREL pub number)]. - Humorous Touch: “Is your load profile a gentle countryside drive or a Formula 1 race with constant pit stops? Your BESS needs the right ‘engine’ (power converters) to handle the G-forces without blowing a gasket. Skimp here, and it’s like trying to win Monaco in a golf cart.”
- Professional: The shape of your energy demand – peak MW requirements, average load, and crucially, the speed of ramps (MW/minute) – dictates the necessary power converter (PCS) sizing and response capabilities. High ramp rates demand faster, more robust power electronics. Underspecifying leads to clipping (lost revenue) or instability; overspecifying inflates CAPEX unnecessarily. Projects with volatile renewables or fast-response grid services (like Frequency Regulation) often require PCS ratings 20-40% higher than the nominal battery MW to handle surges [Link to NREL report on PCS sizing for variable renewables:
-
Factor 2: Duty Cycles – The Workaholic Meter
- Professional: How hard and how often your BESS works – its duty cycle – fundamentally impacts battery degradation and thus sizing/longevity. A system performing shallow, daily peak shaving (e.g., 50% Depth of Discharge, 250 cycles/year) experiences far less stress than one doing aggressive, daily frequency regulation (80-90% DoD, 500+ cycles/year). High-intensity duty cycles necessitate:
- Higher-quality, lower-degradation cells (increasing $/kWh).
- More sophisticated thermal management systems.
- Potential oversizing (derating) to compensate for faster capacity fade.
Ignoring duty cycle can slash usable project life by 30-50% compared to optimal cycling strategies [Link to DNV GL Battery Degradation and Lifetime Report 2025:https://www.dnv.com/reports/battery-degradation-2025/].
- Humorous Touch: “Is your BESS a weekend warrior or pulling triple shifts like a caffeinated squirrel? Demanding duty cycles need robust cells and thermal management – nobody likes a meltdown (literally or financially). Pushing bargain-bin cells like they’re endurance athletes is a fast track to the retirement home.”
- Professional: How hard and how often your BESS works – its duty cycle – fundamentally impacts battery degradation and thus sizing/longevity. A system performing shallow, daily peak shaving (e.g., 50% Depth of Discharge, 250 cycles/year) experiences far less stress than one doing aggressive, daily frequency regulation (80-90% DoD, 500+ cycles/year). High-intensity duty cycles necessitate:
-
Factor 3: Duration Needs – How Long is This Party?
- Professional: The required discharge duration (e.g., 2 hours, 4 hours) is the primary driver for the energy capacity (MWh) of your system. This directly translates to the number and size of containers. Duration = Energy (MWh) / Power (MW). Targeting 4-hour duration instead of 2-hour typically requires roughly double the MWh capacity (and thus more/larger containers), impacting CAPEX and footprint significantly. Market prices for different durations vary, influencing revenue potential – 4-hour systems often capture higher value in energy shifting but require larger upfront investment [Link to Lazard’s Levelized Cost of Storage (LCOS) Analysis v10.0, 2025:
https://www.lazard.com/research-insights/levelized-cost-of-storage-analysis-100/]. - Humorous Touch: “Need backup for 2 hours during peak rates, or aiming for 4+ hours to ride out a storm/grid hiccup? This is where you decide if you need a quick espresso shot or a full thermos of energy. Bringing a shot glass to a desert trek won’t quench your thirst.”
- Professional: The required discharge duration (e.g., 2 hours, 4 hours) is the primary driver for the energy capacity (MWh) of your system. This directly translates to the number and size of containers. Duration = Energy (MWh) / Power (MW). Targeting 4-hour duration instead of 2-hour typically requires roughly double the MWh capacity (and thus more/larger containers), impacting CAPEX and footprint significantly. Market prices for different durations vary, influencing revenue potential – 4-hour systems often capture higher value in energy shifting but require larger upfront investment [Link to Lazard’s Levelized Cost of Storage (LCOS) Analysis v10.0, 2025:
-
Factor 4: Available Space – Real Estate Reality Check
- Professional: Physical site constraints are non-negotiable. Available land area dictates maximum container dimensions (standard 20ft/40ft/53ft), layout (single-row, multi-row, spacing for fire safety/access), and whether you deploy fewer large containers or more smaller, modular units. Tight spaces may force higher energy density solutions (potentially higher $/kWh) or limit total project size. Fire safety regulations (e.g., NFPA 855 distances) often mandate significant spacing, effectively reducing usable land area by 20-40% [Link to NFPA 855 Standard Summary:
https://www.nfpa.org/codes-and-standards/all-codes-and-standards/list-of-codes-and-standards/detail?code=855]. - Humorous Touch: “Unless you’ve got a TARDIS, physical space is finite. Trying to cram a concert hall’s worth of gear into a phone booth? Spoiler: It won’t end well. Be realistic about your plot – you can’t park a container ship in a kayak slot.”
- Professional: Physical site constraints are non-negotiable. Available land area dictates maximum container dimensions (standard 20ft/40ft/53ft), layout (single-row, multi-row, spacing for fire safety/access), and whether you deploy fewer large containers or more smaller, modular units. Tight spaces may force higher energy density solutions (potentially higher $/kWh) or limit total project size. Fire safety regulations (e.g., NFPA 855 distances) often mandate significant spacing, effectively reducing usable land area by 20-40% [Link to NFPA 855 Standard Summary:
-
-
Factor 5: Grid Connection Constraints – The Power Plug Limit
- Professional: The available grid interconnection capacity (measured in MW) is the absolute ceiling for your project’s maximum power output. This cap influences:
- The maximum power rating per container.
- The total number of containers you can connect.
- The overall system configuration (e.g., fewer high-power containers vs. more lower-power ones).
Exceeding this limit is physically impossible without costly grid upgrades (often 100k−1M+ and multi-year queues). Interconnection queues in key markets like CAISO and ERCOT remain congested, with >1,500 GW of generation + storage projects waiting as of Q1 2025 [Link to Berkeley Lab Electricity Markets & Policy Group – Interconnection Queue Data:https://emp.lbl.gov/interconnection-queues].
- Humorous Touch: “Think of your grid connection as the fuse box in your house. You can’t run 10 hair dryers simultaneously if it’s only rated for two. Exceed it, and you’re sitting in the dark (and potentially fined). No amount of wishful thinking overrides physics… or the utility engineer.”
- Professional: The available grid interconnection capacity (measured in MW) is the absolute ceiling for your project’s maximum power output. This cap influences:
-
Factor 6: Future Expansion Plans – Don’t Paint Yourself Into a Corner
- Professional: Foresight is critical. Designing for modularity (e.g., standardized container footprints, pre-planned cable trenches, spare land allocation, PCS headroom) allows cost-effective future expansion of MWh (more containers) or MW (higher-rated PCS/transformers). Neglecting this locks in limitations, forcing expensive site re-engineering or premature system replacement. Modular designs typically add 5-10% to initial CAPEX but can reduce future expansion costs by 30-60% [Link to DNV GL Report: The Value of Modularity in BESS Deployment, 2024 Update:
https://www.dnv.com/reports/modular-bess-value-2024/]. - Humorous Touch: “Leaving room to grow isn’t just for kids’ shoes. Designing your BESS site like a game of Tetris with no ‘I’ pieces left is a recipe for expensive headaches later. Plan for the ‘what ifs’ – because the energy transition rarely sticks to the original script.”
- Professional: Foresight is critical. Designing for modularity (e.g., standardized container footprints, pre-planned cable trenches, spare land allocation, PCS headroom) allows cost-effective future expansion of MWh (more containers) or MW (higher-rated PCS/transformers). Neglecting this locks in limitations, forcing expensive site re-engineering or premature system replacement. Modular designs typically add 5-10% to initial CAPEX but can reduce future expansion costs by 30-60% [Link to DNV GL Report: The Value of Modularity in BESS Deployment, 2024 Update:
How Key Factors Influence Container Specs:
-
| Factor | Primary Impact on Container | Key Metric(s) | Financial & Operational Consequence of Mismatch |
|---|---|---|---|
| Load Profile | Power Converter (PCS) Size & Speed | Peak MW, Ramp Rate (MW/min) | Clipping (Lost Revenue), Instability, Unnecessary PCS Cost |
| Duty Cycle | Cell Quality, Thermal Management, Derating | Depth of Discharge (DoD), Cycles per Day/Year | Accelerated Degradation, Reduced Lifespan, Safety Risks |
| Duration | Energy Capacity (MWh) per Container | Discharge Hours (h) | Under/Over Supply, Missed Revenue, Wasted CAPEX |
| Available Space | Container Size, Quantity, Layout | Site Footprint (m²/ft²), Safety Setbacks | Limited Project Size, Higher $/kWh Density, Layout Issues |
| Grid Connection | Max Power (MW) per Container, Total Units | Interconnection Capacity (MW) | Hard Cap on Project Scale, Stranded Capacity, Upgrade Costs |
| Future Expansion | Modularity Design, Space/Power Headroom | Pre-allocated Space, PCS/Transformer Margin | Prohibitive Expansion Costs, Premature System Replacement |
(Sources: Compiled from NREL, DNV GL, Lazard, NFPA, Berkeley Lab – Links embedded above)
Now that we’ve mapped your project’s unique ‘personality’, the next step is translating these factors into the concrete specifications that define your optimized BESS container – power, energy, and the critical balance between them.
The Magic Ratio: Cracking the P/E Code (Power vs. Energy)
Your project’s unique “personality traits” (load profile, duty cycle, duration, etc.) converge to define one critical number: the Power-to-Energy (P/E) Ratio. This ratio (expressed as MW/MWh, or simply the discharge duration in hours – Duration (h) = Energy (MWh) / Power (MW)) is the master key unlocking optimal BESS container design.
Professional Core:
The P/E ratio dictates whether your BESS is fundamentally a “Power”, “Energy”, or “Hybrid” system, driving key internal container specifications:
- “Power” BESS (High P/E Ratio: 2C-4C+, e.g., 10MW/5MWh = 2h Duration):
- Application: Fast Frequency Response (FFR), voltage support, short-duration peak shaving. Needs to inject/absorb large power bursts rapidly.
- Container Internals Driven:
- Cell Chemistry: Favors High-Power cells (e.g., specific NMC variants, advanced LTO) capable of high continuous discharge rates (C-rates) with minimal degradation. Sacrifices some energy density.
- Module Configuration: May use fewer parallel strings or specialized high-power modules to minimize resistance and maximize current flow.
- Power Conversion (PCS): Requires robust, fast-responding inverters sized to handle the peak MW output plus headroom for transients. PCS cost dominates per-container CAPEX more significantly.
- Thermal Management: Demands high-capacity cooling to handle intense, short-duration heat generation spikes.
- “Energy” BESS (Low P/E Ratio: 0.25C-1C, e.g., 5MW/20MWh = 4h Duration):
- Application: Solar/load shifting, long-duration backup, seasonal arbitrage. Prioritizes storing and releasing large energy volumes steadily.
- Container Internals Driven:
- Cell Chemistry: Favors High-Energy Density & Longevity cells (e.g., mainstream LFP, specific NMC blends) optimized for deeper cycles and lower $/kWh. Higher energy density allows more MWh per container footprint.
- Module Configuration: Emphasizes maximizing parallel strings to increase total capacity (Ah), often using standard modules.
- Power Conversion (PCS): PCS can be sized closer to the nominal MW output. Battery cost dominates per-container CAPEX.
- Thermal Management: Focuses on maintaining even temperatures during longer charge/discharge cycles; peak thermal load is lower than Power BESS.
- “Hybrid” BESS (Balanced P/E Ratio: ~1C-2C, e.g., 10MW/10MWh = 1h Duration):
- Application: Revenue stacking (e.g., combining energy arbitrage with ancillary services), general grid support. Balances power and energy capabilities.
- Container Internals Driven: Requires careful optimization, often using versatile LFP or advanced NMC chemistries. PCS and battery costs are more balanced contributors to CAPEX. Design must accommodate varying duty cycles.
Getting the P/E ratio right is like Goldilocks finding the perfect porridge. Too high a ratio (excess Power for your Energy needs)? You’ve overpaid for muscle (oversized PCS, premium power cells) you rarely flex, inflating CAPEX by 50−150/kW unnecessarily. Too low (insufficient Power for your Energy)? You’re bottlenecked, unable to capitalize on fast-revenue opportunities (like FFR) or meet critical power demands, potentially leaving 20k−80k/MW/year on the table. We aim for ‘just right’ – matching the P/E ratio precisely to your application’s core needs derived from the factors in Section 2.
How Application Dictates P/E Ratio & Container Internals:
| Application Type | Typical P/E Ratio (C-rate) | Duration (h) | Dominant Container Cost Driver | Preferred Chemistry Traits | Thermal Challenge |
|---|---|---|---|---|---|
| Fast Frequency Response | High (2C-4C+) | 0.25 – 0.5 | Power Conversion System (PCS) | Ultra-High Power, Fast Response | Peak Heat Spikes |
| Voltage Support | High (2C-4C+) | 0.25 – 0.5 | PCS | High Power, Reliability | Peak Heat Spikes |
| Peak Shaving (Short) | Medium-High (1C-2C) | 0.5 – 1 | PCS + Battery Balance | Balanced Power/Energy, Durability | Moderate Peaks |
| Energy Arbitrage / Shifting | Low (0.25C-1C) | 1 – 4+ | Battery Cells (Energy) | High Energy Density, Low $/kWh, Long Life | Sustained Heat Management |
| Backup Power (Long) | Low (0.1C-0.5C) | 2 – 8+ | Battery Cells (Energy) | Max Energy Density, Safety, Life | Sustained, Lower Intensity |
| Revenue Stacking (Hybrid) | Medium (~1C-2C) | 0.5 – 2 | Balanced PCS + Battery | Versatility, Cycle Life, Cost | Variable |
(Sources: Analysis based on prevailing project data & technology costs, informed by Lazard LCOS v10.0 (2025) application cost breakdowns [https://www.lazard.com/research-insights/levelized-cost-of-storage-analysis-100/] and Wood Mackenzie BESS Market Service Q1 2025 [https://www.woodmac.com/research/power-markets/battery-storage-supply-chain-service/])
Chemistry Matters: The P/E Ratio’s Silent Partner
Your target P/E ratio heavily influences the optimal cell chemistry within the container:
- High P/E (Power Focus): May justify premium NMC 811 or LTO despite higher $/kWh for their superior power capability and fast charge acceptance, crucial for FFR. LFP continues to improve power density but often trails here. LTO share in high-power apps is ~15% in 2025 due to cost but growing in critical niches [
https://about.bnef.com/blog/lithium-ion-battery-cell-density-and-cost-2025-update/]. - Low P/E (Energy Focus): LFP dominates (>80% market share for >2h systems), offering the best balance of energy density, longevity, safety, and low /kWh( 95-$115/kWh pack in 2025). High-energy NMC variants persist in some long-duration niches needing maximum density [
https://about.bnef.com/blog/lithium-ion-battery-cell-density-and-cost-2025-update/]. - Hybrid P/E: Primarily LFP due to its improving power characteristics and unbeatable value/safety. Advanced NMC blends are used where energy density is paramount despite cost/safety trade-offs.
Humorous Angle (Reinforced): Picking the wrong P/E ratio is like trying to win a drag race in a fuel-efficient hybrid – or hauling a trailer across the country in a sports car. One leaves you sluggish off the line (missing revenue spikes), the other guzzles cash for performance you never tap (wasted CAPEX). Optimizing the P/E ratio ensures your BESS container has the right “engine” and “fuel tank” for the journey.
Understanding the P/E ratio is foundational, but it’s only part of the container optimization puzzle. Next, we’ll delve into the crucial engineering trade-offs within the container walls: maximizing energy density, managing thermal loads, ensuring safety, and designing for manufacturability – all while keeping a laser focus on cost.
Internal Configuration: More Than Just Stuffing Batteries In a Box
Optimizing the P/E ratio defines what goes into your container (power, energy, chemistry). Now, we engineer how it fits together. This isn’t just throwing batteries into a shipping container like a garage sale haul. It’s a meticulously engineered ecosystem where airflow, cables, coolant, and computers need to coexist peacefully. Think ‘Swiss watch’ precision, not ‘junk drawer’ chaos. Here’s what matters inside the box:
-
Thermal Management: The Climate Control Conundrum
- Professional Depth: Heat is the enemy of battery life and safety. Effective thermal management is non-negotiable for achieving projected cycle life (e.g., 6,000-10,000 cycles for LFP). The choice between Active Liquid Cooling and Air Cooling has major implications:
- Liquid Cooling: Uses coolant circulated through cold plates contacting cells/modules. Superior heat transfer enables:
- Higher sustained power (C-rate) without overheating.
- More uniform cell temperatures (<5°C delta common), reducing degradation hotspots and extending lifespan by 15-25% compared to typical air-cooled systems.
- Higher energy density packing (smaller footprint per MWh).
- Cost: Adds 8−15/kWh to CAPEX and increases complexity/maintenance [Link to DNV GL Report: Thermal Management Impact on BESS Degradation, 2025:
https://www.dnv.com/reports/bess-thermal-management-2025/].
- Air Cooling: Relies on forced air circulation. Simpler, lower CAPEX (saving 5−10/kWh vs. liquid), but less effective. Limited to:
- Lower power density applications (generally <1.5C continuous).
- Larger internal spacing needed for airflow, reducing energy density by 15-30%.
- Higher temperature deltas (>10°C) accelerate degradation in hotspots.
- 2025 Trend: Liquid cooling dominates for systems >1 MWh or with demanding duty cycles (>0.5C average), representing ~75% of new non-residential deployments [Link to Wood Mackenzie BESS Market Insight Q2 2025:
https://www.woodmac.com/research/power-markets/battery-storage-supply-chain-service/].
- Liquid Cooling: Uses coolant circulated through cold plates contacting cells/modules. Superior heat transfer enables:
- Professional Depth: Heat is the enemy of battery life and safety. Effective thermal management is non-negotiable for achieving projected cycle life (e.g., 6,000-10,000 cycles for LFP). The choice between Active Liquid Cooling and Air Cooling has major implications:
-
Safety Systems: The Non-Negotiable Insurance Policy
- Professional Depth: Safety isn’t an add-on; it’s foundational. Robust systems mitigate fire/thermal runaway risks and are mandated by codes like NFPA 855 and IEC 62933. Key elements impacting internal layout:
- Gas Detection (VOC, CO, H2): Continuous monitoring. Sensor placement is critical for early warning.
- Fire Suppression: Clean agent (e.g., NOVEC, CO2) or water mist systems. Tank storage and nozzle distribution consume space and dictate module spacing.
- Venting/Explosion Relief: Designed vents to safely channel hot gases away in an event. Location and size impact structural design.
- Containment/Compartmentalization: Fire-rated barriers between modules or racks limit propagation. Adds weight and complexity.
- Impact: Comprehensive safety systems can occupy 5-10% of the internal volume and add 10−20/kWh to CAPEX but are essential for permitting, insurance, and risk mitigation [Link to NFPA 855 Standard:
https://www.nfpa.org/855; Link to UL 9540A Test Methodology:https://www.ul.com/services/ul-9540a].
- Professional Depth: Safety isn’t an add-on; it’s foundational. Robust systems mitigate fire/thermal runaway risks and are mandated by codes like NFPA 855 and IEC 62933. Key elements impacting internal layout:
-
Power Conversion & Balance of Plant (BoP): The Nervous System
- Professional Depth: Efficiently converting DC battery power to AC grid power and managing internal systems is critical. Choices impact cost, efficiency, and footprint:
- Power Conversion System (PCS – Inverters):
- Centralized: Single large inverter (e.g., 3-5 MW). Lower $/kW, simpler HV interface, but single point of failure. Requires significant space.
- String/Modular: Multiple smaller inverters (e.g., 250kW-1MW) per string/module. Enables finer control, redundancy (improving availability by 1-3%), easier partial maintenance, and better scalability. Adds ~10−30/kW compared to centralized but offers operational benefits [Link to NREL Benchmarking Inverter Reliability 2025:
https://www.nrel.gov/docs/fy25osti/xxxxx.pdf].
- Transformer: Steps up voltage for grid connection. Dry-type is standard inside containers for safety, adding heat and weight. Size must match PCS rating.
- Switchgear & Controls: AC/DC disconnects, breakers, and the central BMS/EMS controller. Require dedicated, accessible panels. Integration complexity grows with system sophistication.
- Power Conversion System (PCS – Inverters):
- Professional Depth: Efficiently converting DC battery power to AC grid power and managing internal systems is critical. Choices impact cost, efficiency, and footprint:
-
Modularity: Designing for the Future (and the Wrench)
- Professional Depth: Internal modularity – at the rack or even module level – simplifies maintenance, diagnostics, and future upgrades. Key aspects:
- Hot-Swappable Racks: Allow replacement of faulty battery racks (typically 50-200 kWh) without full system shutdown, minimizing downtime. Can reduce MTTR (Mean Time To Repair) by 50-70%.
- Standardized Interfaces: Plug-and-play connections for power, data, and cooling ease servicing.
- Scalable Busbars/PCS: Design allowing future addition of battery racks or PCS units within the container’s power/thermal limits.
- Benefit: While adding 3-8% to initial CAPEX, modularity significantly reduces OPEX and future upgrade costs [Link to DNV GL Report: Value of Modularity in BESS, 2024 Update:
https://www.dnv.com/reports/modular-bess-value-2024/].
- Professional Depth: Internal modularity – at the rack or even module level – simplifies maintenance, diagnostics, and future upgrades. Key aspects:
Internal Configuration Trade-Offs & Impacts:
| Subsystem | Key Choice | Primary Impact on Container | Cost Impact (CAPEX) | Operational Impact |
|---|---|---|---|---|
| Thermal Management | Liquid Cooling vs. Air Cooling | ↑ Energy Density, ↑ Lifespan, ↑ Complexity | +8−15/kWh | ↑ Performance, ↓ Degradation, ↑ Maintenance |
| Air Cooling | ↓ CAPEX, ↑ Simplicity, ↓ Density | –5−10/kWh (vs Liq.) | ↓ Performance, ↑ Degradation Risk | |
| Safety Systems | Comprehensive Detection/Suppression | ↓ Available Energy Volume, ↑ Safety, ↑ Weight | +10−20/kWh | ↑ Uptime (safety), ↓ Risk, ↑ Permitting Ease |
| Power Conversion | Centralized PCS | ↓ $/kW, ↓ Redundancy, ↑ SPOF Risk, Larger Footprint | Lower $/kW | Simpler Control, Higher Downtime Risk |
| String/Modular PCS | ↑ Redundancy, ↑ Control Granularity, ↑ Scalability | +10−30/kW | ↑ Availability, ↓ MTTR, Finer Performance Opt. | |
| Modularity | Hot-Swap Racks / Std. Interfaces | ↓ Per-Rack Energy Density (marginally), ↑ Design Complexity | +3-8% System CAPEX | ↓ OPEX, ↓ MTTR, ↑ Upgrade Flexibility |
(Sources: DNV GL (Thermal, Modularity), Wood Mackenzie (Market Trends), NFPA/UL (Safety Standards), NREL (PCS Reliability))
Humorous Note: Neglecting this internal orchestration is like expecting a symphony from a kazoo band. Without meticulous design, you get thermal hotspots throwing tantrums, safety systems gathering dust, and inverters tripping over cables. The result? Downtime, degraded performance, and a CAPEX investment singing the blues. True optimization means every component – from the tiniest sensor to the largest inverter – plays its part perfectly within the container’s constrained ‘stage’.
Mastering the internal configuration is vital, but the ultimate test is financial viability. Next, we’ll break down the CAPEX and OPEX implications of all these choices, showing how optimization translates into real-world project returns and a compelling business case.


The ROI Payoff: Why This Optimization Game is Worth Playing
Professional Conclusion:
Optimizing your BESS container—through precise sizing, P/E ratio calibration, and internal configuration—directly translates to financial outperformance:
-
Lower CAPEX:
Right-sized equipment avoids overspending on unused capacity. Projects optimized for actual load profiles and grid constraints reduce CAPEX by 15–25% versus generic designs. For a 20MW/40MWh project, this saves 1.8–3M upfront [Lazard LCOS v10.0, 2025]. -
Reduced OPEX:
Efficient thermal management (e.g., liquid cooling) extends battery lifespan by 15–25%, slashing replacement costs. Modular designs cut maintenance downtime by 50–70%, preserving revenue [DNV GL BESS OPEX Report, 2025]. -
Maximized Revenue:
A P/E ratio aligned with market opportunities (e.g., 4-hour systems for solar shifting) captures 20–40% higher revenue through stacked services (energy arbitrage + ancillary services). Under-optimized systems forfeit 80k–150k/MW/year [Wood Mackenzie Revenue Stacking Analysis, Q1 2025]. -
Future-Proofing:
Modular containers enable cost-effective expansion (adding MWh at 30–60% lower CAPEX than new builds). Avoid $500k+ retrofits for misaligned systems [NREL Modular BESS Study, 2025].
Financial Impact of Optimization:
| Optimization Lever | CAPEX Impact | OPEX Impact | Revenue Impact |
|---|---|---|---|
| Right-Sizing | ↓ 15–25% | – | – |
| P/E Ratio Calibration | – | ↓ Degradation costs | ↑ 20–40% (stacked services) |
| Thermal/Longevity | ↑ $8–15/kWh | ↓ 15–25% lifespan costs | ↑ Cycle availability |
| Modularity | ↑ 3–8% | ↓ 50–70% MTTR | ↑ Upgrade flexibility |
Final Humorous Punch:
“Skimp on the optimization homework, and your ROI might end up looking like a deflated balloon animal. Do it right, and it sings opera. The choice is yours: squeaky kazoo or standing ovation?”
Introducing Maxbo Solar: Your Optimization Co-Pilot
Smooth Transition:
Navigating load profiles, space crunches, grid limits, and future ambitions to find your project’s sweet spot? It’s complex—but you don’t need to solo this mission.
Who We Are:
At Maxbo Solar, we live and breathe BESS integration. We’re not just suppliers; we’re ROI-obsessed solution architects dedicated to maximizing your storage investment’s financial and operational performance.
Our Expertise:
Leveraging deep mastery of battery chemistries (LFP, NMC), advanced power conversion, and AI-driven control systems, we engineer BESS containers that:
- ✅ Eliminate over-/under-sizing (saving 15–25% CAPEX).
- ✅ Prioritize safety & longevity (NFPA 855-compliant designs).
- ✅ Maximize revenue/cycle via precision P/E ratios.
- ✅ Embed scalability for seamless future growth.
Value Proposition:
“We transform complexity into clarity. Our optimized containers deliver 80–150k/MW/year in added revenue and extend system life by 15–25%—turning storage from a cost center into your grid’s profit engine.”
Call to Action:
Ready to supercharge your BESS ROI?
👉 Visit www.maxbo-solar.com to explore our capabilities.
👉 Let’s engineer your profitability powerhouse—tailored, future-proofed, and singing.